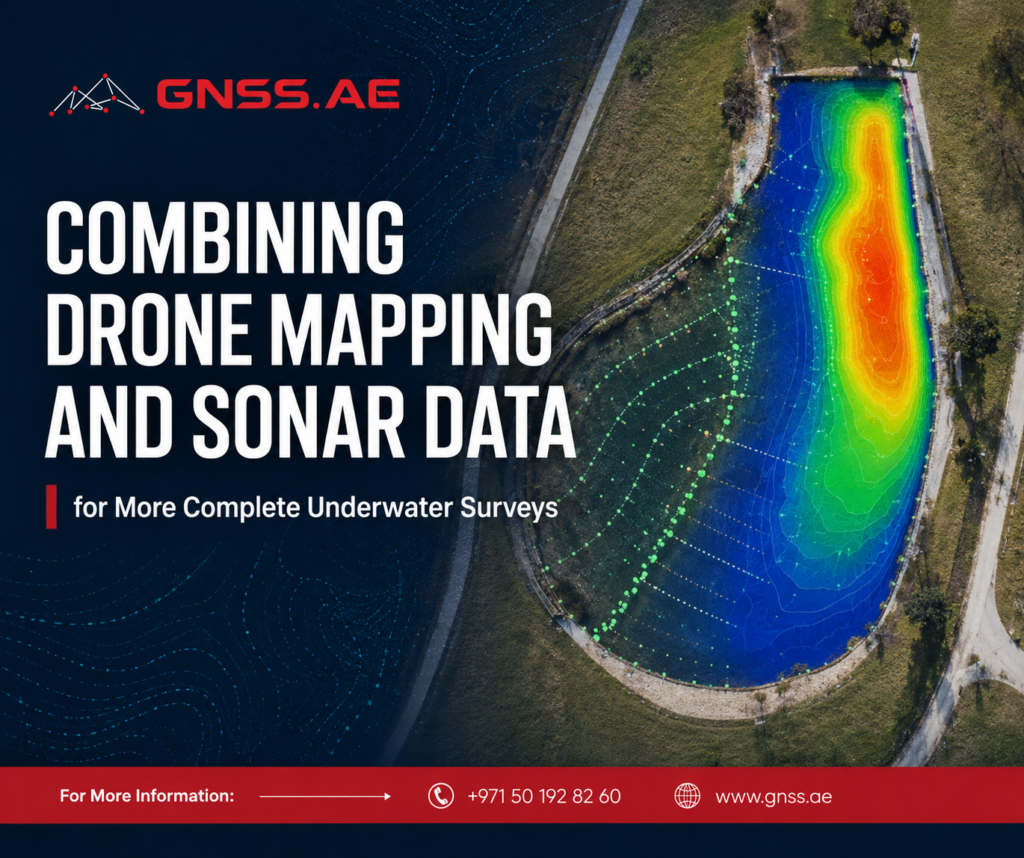
A reservoir bank, harbor wall or river crossing does not end at the waterline. Its condition depends on the shape of the surrounding land, the submerged bed, objects on the bottom and, in many projects, the way water moves through the site. Yet these features cannot all be measured effectively with one sensor.
Drone photogrammetry and LiDAR are well suited to mapping the terrain and infrastructure above the water. Sonar continues the survey below the surface, where cameras and standard topographic LiDAR lose visibility. Acoustic Doppler current profilers can add another layer by measuring water velocity through the water column.
When these datasets share the same coordinate system, vertical datum and survey time frame, they can form a continuous view of the site for modelling, inspection and planning.
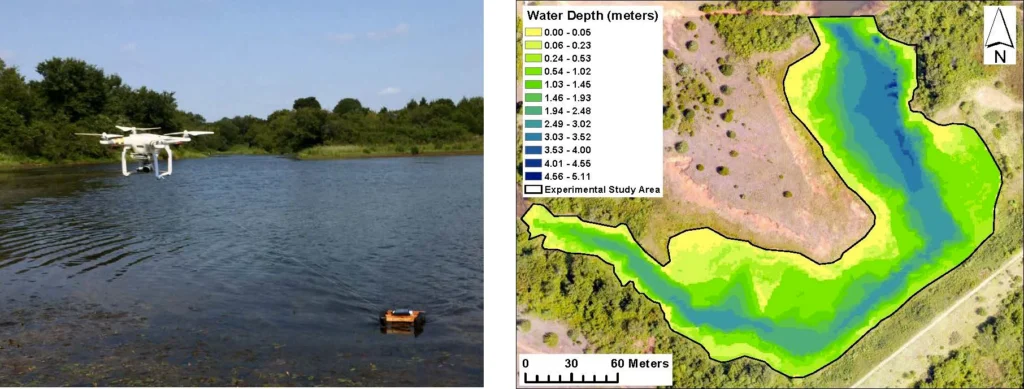
Land and hydrographic surveys are often planned separately. The aerial team produces an orthomosaic, point cloud and terrain model, while the hydrographic team collects depths along boat tracks. If the datasets use different datums or stop short of the shoreline, a gap can remain in the most changeable part of the site.
Very shallow water is particularly difficult. It may be too deep or unsafe for a surveyor to enter but too shallow for a boat or uncrewed surface vessel to navigate. Clear water may allow the bed to be reconstructed from drone images, while turbidity, glare, waves or aquatic vegetation can make the same method unreliable a few meters away.
The practical solution is to treat the site as one survey and assign each part to the sensor that can observe it most reliably.
Data source | Example equipment | Main output | Best use | Important limitation |
UAV photogrammetry | Orthomosaic, point cloud and surface model | Banks, exposed bed, structures and visible shallow bottom | Underwater points require refraction correction; clarity, glare and waves affect the result | |
UAV topographic LiDAR | Dense 3D point cloud | Terrain, vegetation, cliffs, embankments and infrastructure | Standard near-infrared LiDAR does not reliably map submerged terrain; bathymetric LiDAR is a separate system | |
Echo sounder | Georeferenced depth measurements | Direct bathymetry in navigable or turbid water | Coverage depends on beam geometry and survey-line spacing | |
Side-scan sonar | Acoustic image of the bottom | Locating objects, debris, pipelines and bottom-texture changes | It provides imagery rather than a complete, survey-grade depth surface on its own | |
ADCP | Current velocity profiles and discharge data | Rivers, channels, intakes, outfalls and hydraulic studies | It describes water movement, not detailed seabed imagery |
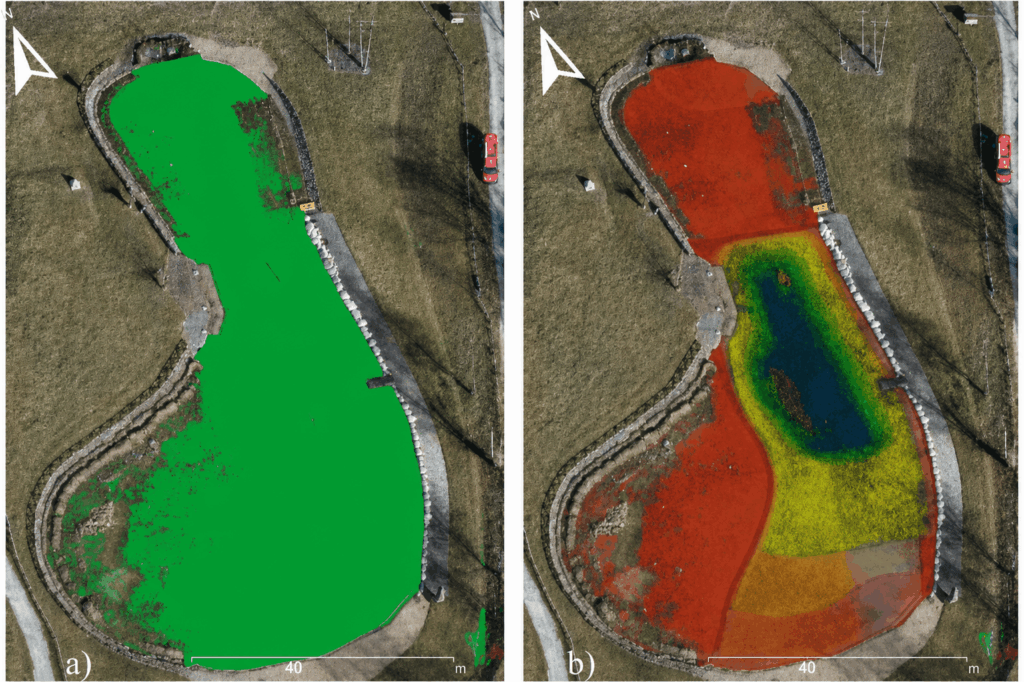
Drone imagery provides spatial continuity. A single flight can document the shoreline, structures and exposed or visible parts of the bed. Structure-from-Motion processing turns overlapping photographs into a georeferenced point cloud and orthomosaic.
Underwater photogrammetry is not simply normal photogrammetry extended below the surface. Light bends as it passes from water to air, making the bottom appear shallower than it is. The water-surface elevation must be modelled, and the submerged points must be corrected for refraction.
A 2025 shallow-water study illustrates the effect. In that specific lake survey, the RMSE of uncorrected photogrammetric depths was 41 cm. After geometric refraction correction, it fell to 4 cm. Corrected UAV bathymetry and single-beam measurements differed by an average of 3 cm in overlapping areas, and the optical method reached depths of 4–5 m under unusually favorable visibility conditions.
Acoustic measurements provide an independent check and continue into water that is too deep or opaque for optical reconstruction. Echo sounders measure depth along survey lines, while side-scan sonar records return across a swath. Together, they can distinguish a change in elevation from debris, a pipe or a scour hole.
Begin with the decision the survey must support. Volume calculations need direct depth control, a debris search requires acoustic imagery, and a hydraulic model may require terrain, depths and velocity profiles. Accuracy, point density and the smallest target should determine the sensors and line spacing.
All measurements should use a documented horizontal reference system and vertical datum. Survey control, GNSS observations, water level and tidal corrections must be tied together. Measure sensor offsets, including the sonar position relative to the GNSS antenna and towfish layback where applicable.
Fly when the surface is calm and glare is limited. Photogrammetry requires high image overlap and visible, textured features. Ground control and independent checkpoints remain useful even with an RTK-equipped drone. LiDAR strengthens coverage over vegetation, steep banks and structures; photogrammetry adds colour and a detailed orthomosaic.
Plan main lines and cross-lines according to the target and bottom complexity. Record water level and sound-velocity information. For side-scan work, keep speed, altitude and towfish geometry consistent. Where the bed changes rapidly, reduce line spacing or add targeted passes.
Correct photogrammetric refraction before using submerged points as elevations. Clean false sonar returns caused by vegetation, bubbles, multiple reflections or poor bottom detection. Check GNSS quality, motion, sound velocity, water levels and sensor offsets before fusion.
Create overlap instead of joining methods at a hard boundary. It allows residuals to be calculated, systematic offsets to be found and the most reliable source to be selected for each zone. Do not smooth a disagreement until its cause is understood: a seamless model can still be vertically wrong.
Depth alone may not explain the condition of an underwater site. Two complementary SOUTH instruments can add different types of evidence.
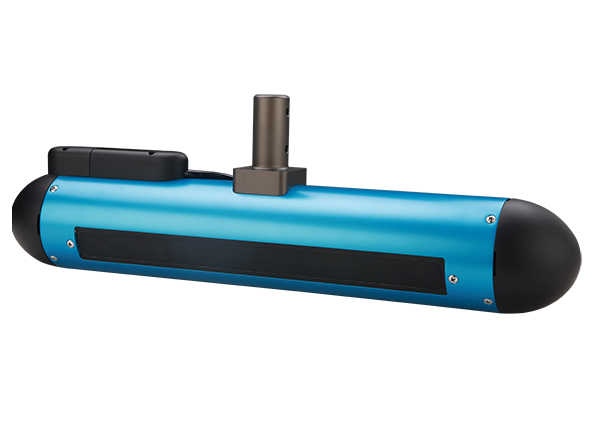
The SOUTH Hysword SS500 is a portable 500 kHz side-scan sonar for high-resolution acoustic imaging. It can help locate debris, pipelines, submerged structures, scour, and changes in bottom texture after bathymetry has established their geographic and vertical context. The manufacturer specifies CHIRP and continuous-wave modes, a maximum range of 150 m per side, built-in attitude, heading, and temperature sensors, and XTF-compatible output. Its primary role is target detection and interpretation, not replacing an echo sounder’s depth measurements.
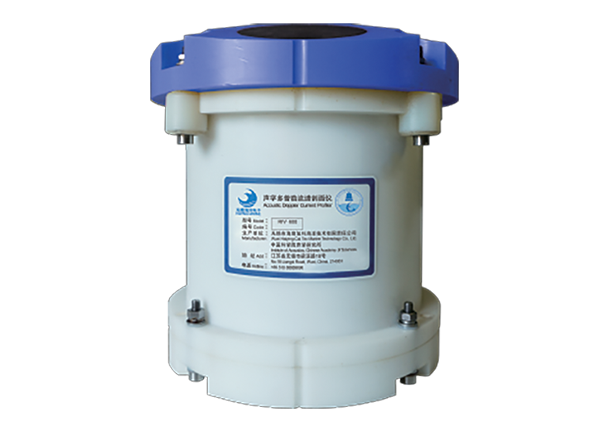
The SOUTH RIV Series consists of four-beam ADCPs that measure current velocity through multiple water-column layers. The RIV-300, RIV-600, and RIV-1200 use different frequencies: lower-frequency models reach farther, while the 1200 kHz version supports smaller layer sizes for shallow, detailed profiles. Listed profiling ranges extend from 0.2–35 m to 1–120 m, depending on the model, with 1 mm/s velocity resolution. Bottom tracking and optional positioning support moving-vessel measurements.
Around a bridge, outfall, channel, or river bend, RIV current profiles can help explain scour or sediment accumulation visible in the bathymetric and side-scan data. They can also support discharge calculations and hydraulic-model calibration.
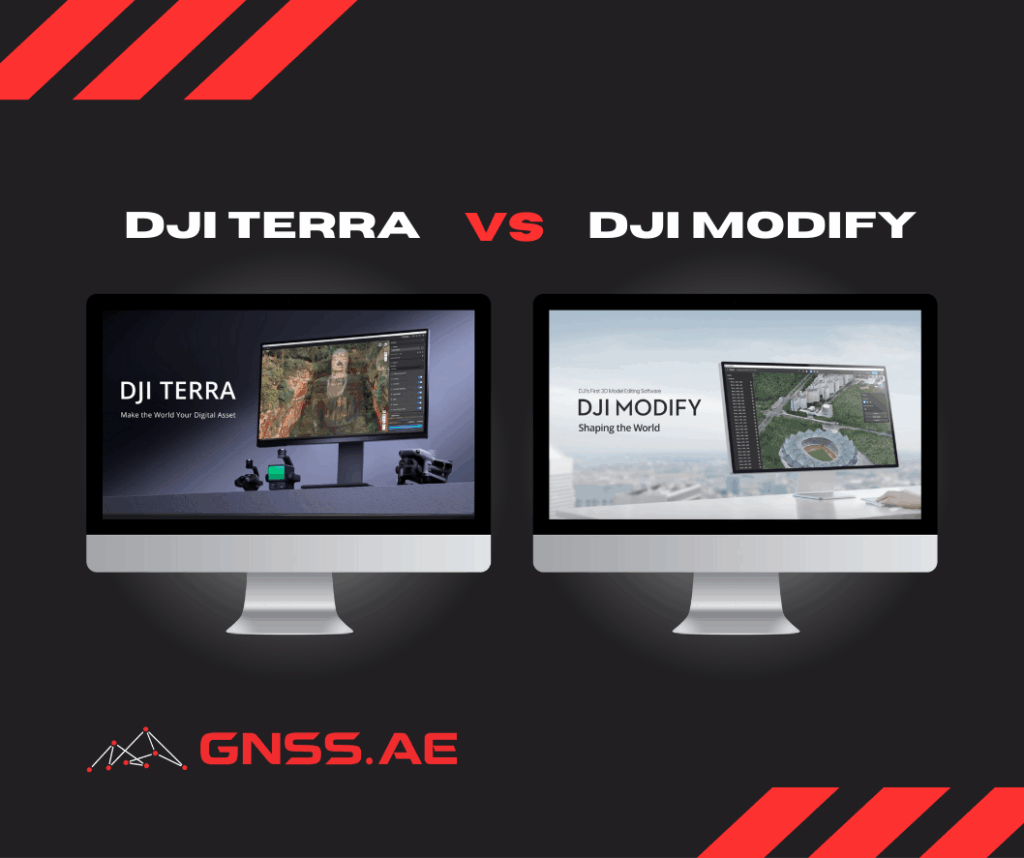
Both DJI Terra and Agisoft Metashape can transform overlapping drone images into georeferenced point clouds, digital elevation models, orthophotos, and 3D models.
The main photogrammetric workflow includes:
DJI Terra provides a closely integrated workflow for imagery and LiDAR collected with supported DJI systems. It is well suited to standard aerial reconstruction and can process both visible-light images and DJI LiDAR data.
Agisoft Metashape offers extensive control over camera alignment, markers, masks, point-cloud filtering, classification, and export settings. This flexibility can be useful around water, where reflections, moving waves, vegetation, and weak bottom texture often create incorrect points.
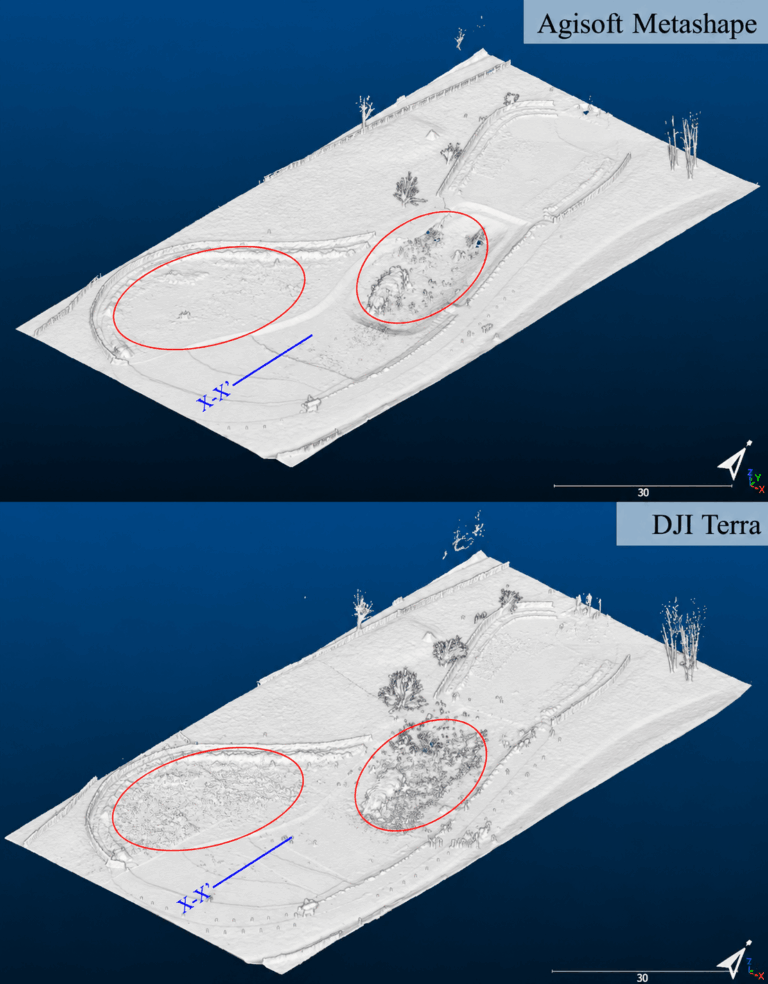
The software should still be selected according to the dataset rather than by name alone. In the 2025 shallow-water study, DJI Terra 4.4 and Agisoft Metashape 2.2 produced similar results for the exposed parts of the site. In submerged areas, however, the DJI Terra point cloud contained more noise, particularly as depth increased. The researchers therefore used the Metashape point cloud for refraction correction and data fusion. This was the result of one dataset and processing configuration, rather than a general performance ranking.
Combined aerial, bathymetric, imaging and current data can support:
With consistent control, datums and acquisition settings, repeated surveys can compare changes above and below the waterline within one model.
Drone photogrammetry and LiDAR describe the terrain and structures above the water and, in favorable cases, part of the shallow bed. Echo sounders continue the elevation model into deeper or opaque water. Side-scan sonar adds interpretable images of the seabed, while an ADCP records the currents acting above it.
With reliable positioning, a common vertical reference, adequate overlap, and independent checks, they create a model in which shoreline geometry, underwater depth, submerged objects, and water movement can be analyzed together.
A drone bathymetric survey combines aerial mapping with depth measurements to model terrain above and below the waterline. Photogrammetry can cover visible shallows, while echo sounders measure deeper or turbid water.
Yes, but optical mapping requires clear, calm and relatively shallow water. Underwater points must also be corrected for light refraction before they can be used as accurate elevations.
Standard topographic LiDAR usually cannot map submerged terrain reliably. Specialized bathymetric LiDAR uses green laser pulses, although its effective depth still depends on water clarity.
An echo sounder measures water depth and supports bathymetric modeling. Side-scan sonar produces acoustic images for locating debris, pipelines and other seabed features.
The two methods cover different parts of the site. Combining them can close the gap between land and hydrographic surveys and produce a more continuous model of the shoreline and submerged terrain.