Modern farms operate across large areas, where a local problem can be easy to miss. A blocked irrigation emitter, uneven emergence, storm damage or a new patch of weeds may initially affect only a small part of a field. By the time the problem is noticed during a routine inspection, the window for action may already be getting shorter.
Drones give agricultural teams a faster way to assess field conditions and, in some cases, carry out work from the air. They can identify areas that need closer inspection, measure differences in crop development, help locate irrigation problems and support more targeted spraying or spreading.
This article examines where drones provide practical value in agricultural operations, what data they collect and how that information can lead to action in the field.
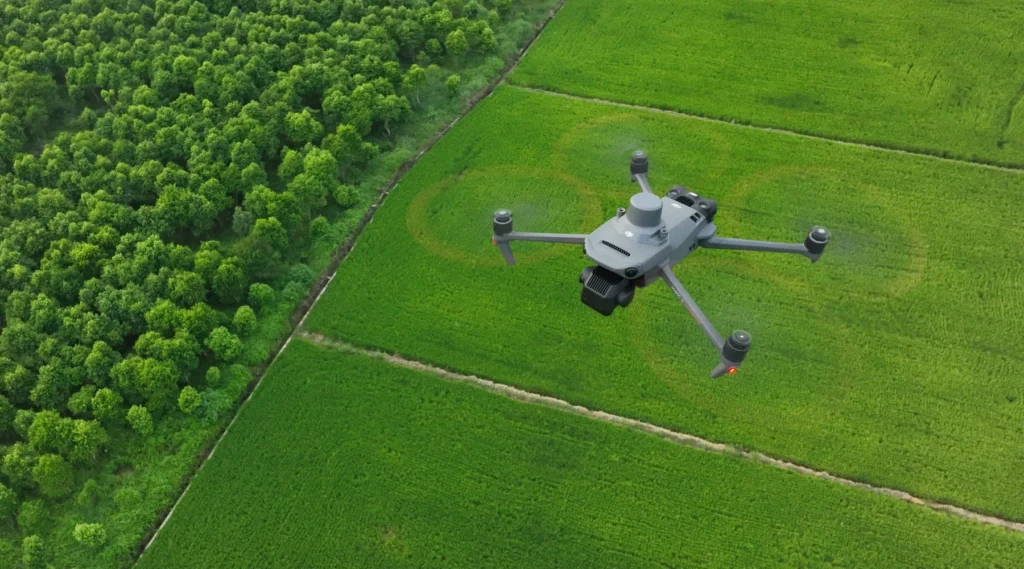
Agricultural drones generally serve one of two roles.
Survey drones carry cameras and other sensors to collect data across a field. Images are captured with geographic coordinates and can be processed into maps showing differences in crop conditions. Repeating the same survey over time also makes it easier to track how a problem develops and whether the crop is recovering after an intervention.
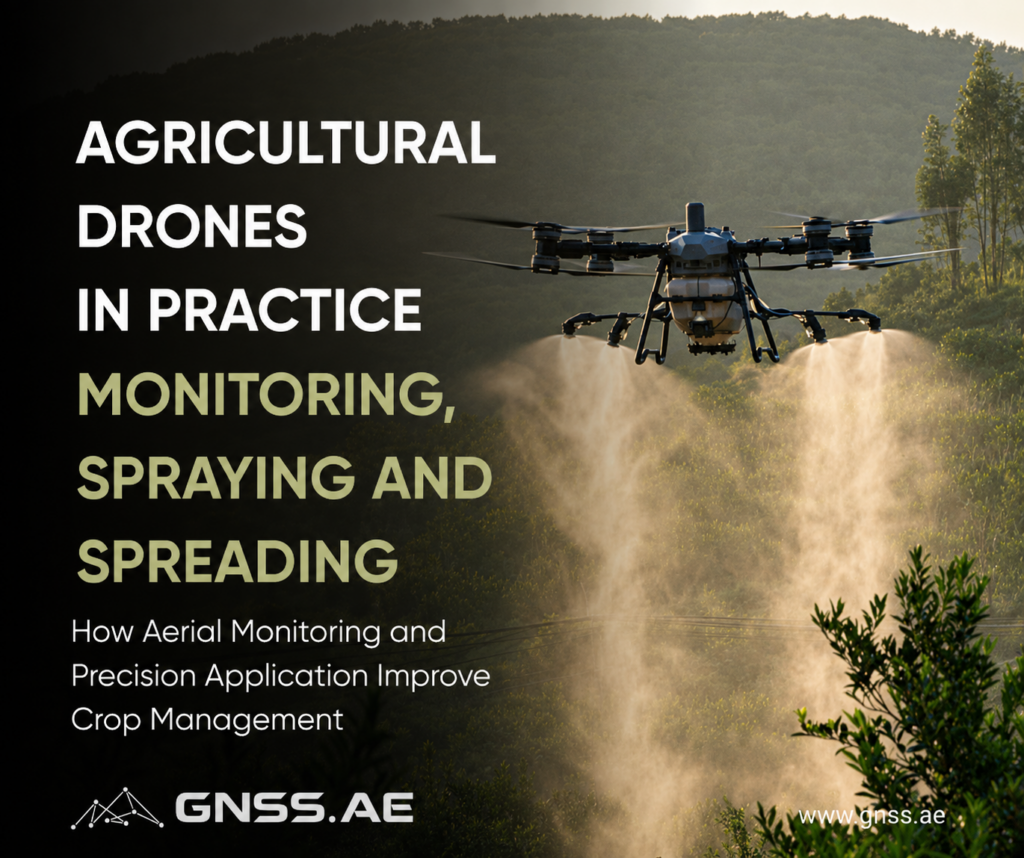
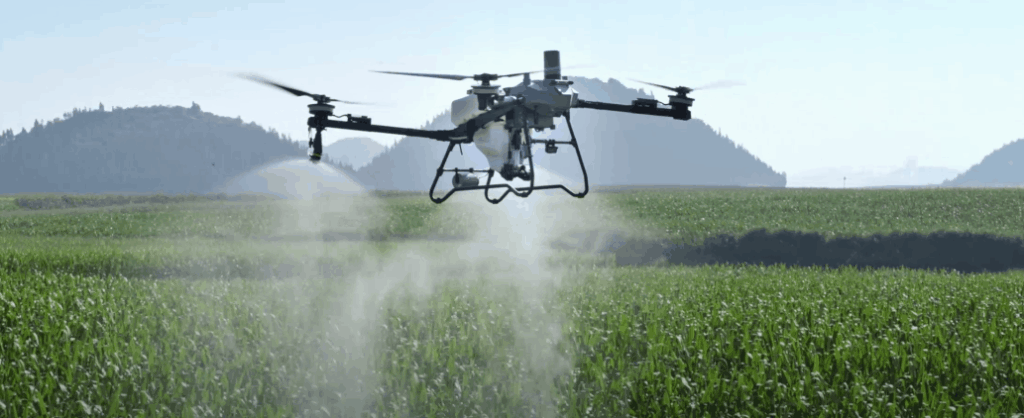
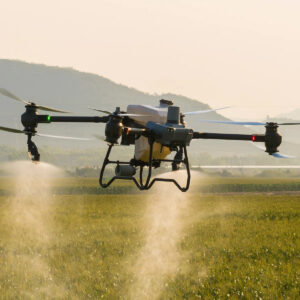
Application drones carry liquid or granular materials. They can spray, fertilize or distribute seed along planned routes, including in areas where wet ground, dense crops or uneven terrain make access difficult for conventional machinery.
For example, the DJI Mavic 3 Multispectral combines a 20 MP RGB camera with four 5 MP multispectral sensors for crop surveys. Irrigation analysis may also require a radiometric thermal camera, while spraying and spreading require a platform with a suitable tank, pumps, nozzles or granular feeder.
An aerial survey is most useful when it tells the agronomist where to look next. RGB images can be stitched into a single field map that makes gaps in planted rows, lodged crops, standing water and visible damage easier to spot. A multispectral survey adds another layer by using reflected red, red edge and near-infrared light to calculate NDVI and NDRE.
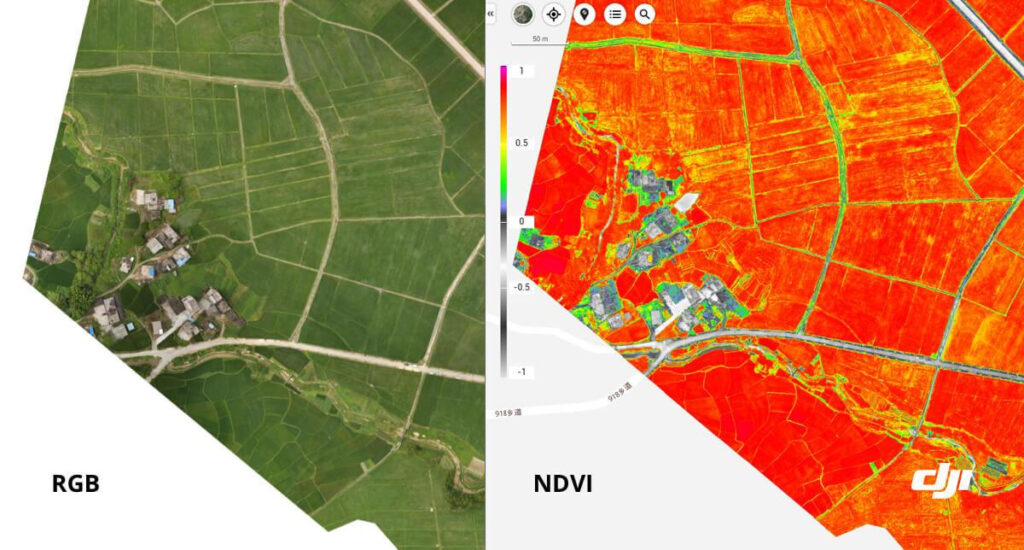
NDVI runs from −1 to +1. Dense crops at peak growth often sit around 0.6–0.9, while sparse or senescing vegetation may be closer to 0.2–0.5.
The most useful comparison is usually made within the same field and flight. If most of a crop block is close to 0.70 and a distinct patch falls to 0.43, that patch deserves a closer look. It may have a thinner canopy, lower chlorophyll levels or some form of stress, but the map cannot determine the cause on its own. The agronomist can use the recorded coordinates to check soil moisture, roots, leaves and pest activity without searching the entire field.
Drone output | What it may reveal | Operational response |
RGB orthomosaic | Missing plants, damaged rows, standing water or lodging | Field team checks whether drainage, replanting or another physical intervention is required |
NDVI or NDRE map | Areas developing differently from comparable parts of the field | Agronomist inspects plants, roots, soil moisture, nutrient status and pest activity |
Thermal map | Canopy temperature differences under comparable conditions | Irrigation team checks soil moisture, line pressure, valves and emitters |
Repeated survey | Affected area is expanding, stable or recovering | Manager decides whether to escalate, adjust or complete the intervention |
Water stress affects canopy temperature and plant development. When plants have insufficient water, reduced transpiration can make the canopy warmer than comparable well-irrigated areas. Multispectral data may also show slower canopy development or declining vigor.
A USDA Agricultural Research Service project demonstrated this in commercial blueberry and raspberry fields in Washington State. Researchers collected multispectral and thermal images at least once a month over two years. In one 4.5-hectare field, thermal imagery revealed large under-irrigated sections before the plants showed visible wilting. A ground inspection found that many drip emitters in those areas were plugged.
The project used a MicaSense RedEdge-M multispectral camera with a separate infrared thermal module. The imagery helped the irrigation team narrow its search to the affected sections rather than checking the entire network.
Weeds rarely cover a field evenly. They cluster along headlands and drainage lines or survive in patches missed by an earlier treatment. Drone imagery marks these areas so weed-free ground can be left untreated.
Timing is critical with fast-growing or herbicide-resistant species. Palmer amaranth is harder to control at six inches or taller than at two inches. High-resolution imagery can locate early patches, while analysis software uses plant shape, colour, texture and spectral reflectance to distinguish broadleaf weeds such as Palmer amaranth and kochia from grasses such as johnsongrass and shattercane.
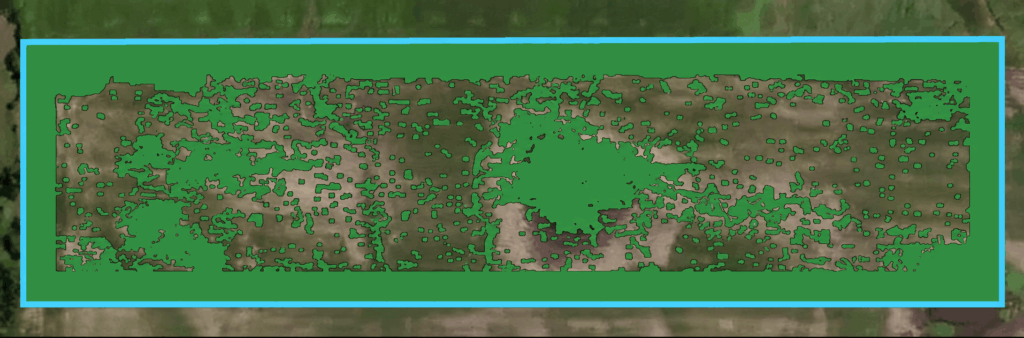
In a corn field trial, drone imagery was used to create a prescription map for an existing commercial sprayer, cutting herbicide use by 50 percent. An 8.7-acre soybean demonstration used 70 gallons of tank mix instead of the 130.5 gallons required for broadcast treatment, saving USD 13.42 per acre. After 17 days, 111 of the 118 monitored weeds were dead, and yield did not differ significantly from the broadcast-treated area.
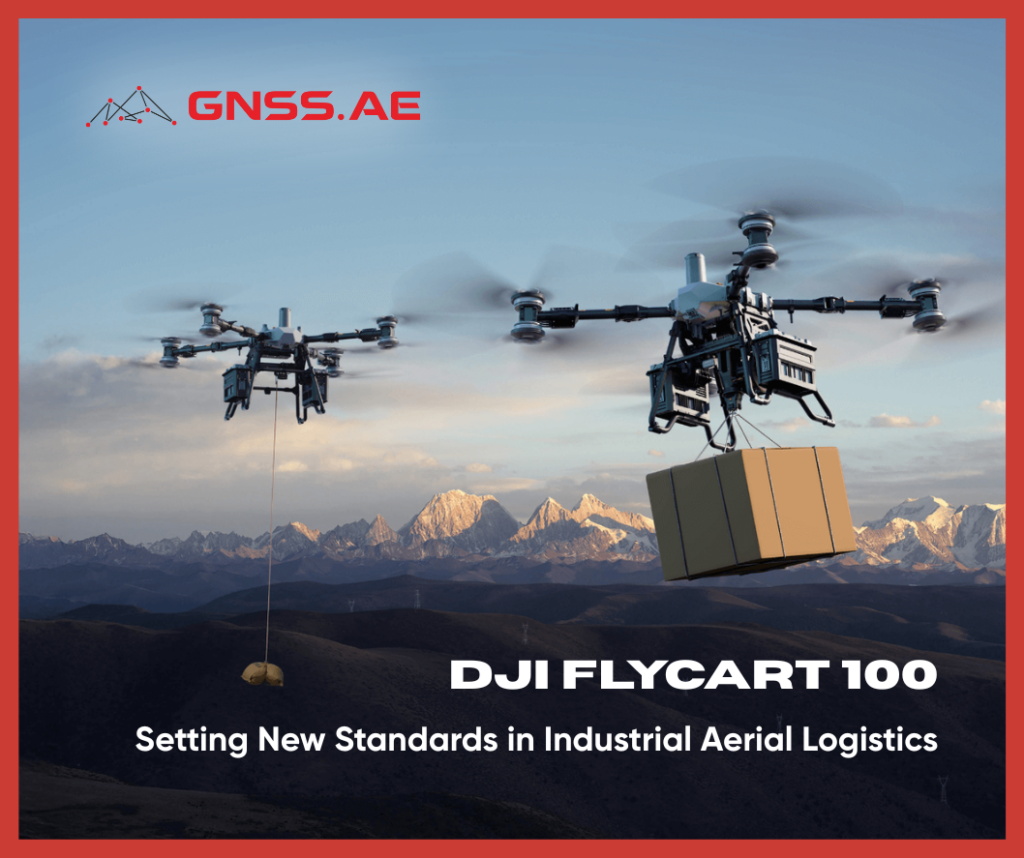
The map can be loaded into a precision ground sprayer or an application drone such as the Agras T50 or T100. Drones are particularly useful where wet ground, slopes or a standing crop restrict machinery access. Equipped with a spreading system, they can also apply seed and granular fertilizer. The system must be calibrated for the material’s particle size, density and required application rate.
Orchards and vineyards introduce additional challenges. Tree height and canopy density vary, rows may follow sloping ground, and tractors can struggle in narrow or wet areas. Repeated machinery passes may also disturb soil or damage the crop.
Modern agricultural drones use combinations of radar, cameras and LiDAR to detect obstacles and maintain a planned height above changing terrain. Three-dimensional orchard maps can define tree positions, elevation and flight routes before treatment begins.
Atomizing or misting systems allow operators to adjust droplet size and flow for different canopy structures. Route spacing, speed and height must be selected to achieve the required coverage without excessive drift.
Automation improves consistency, but supervision remains necessary. Thin branches, wires, sudden wind changes and incomplete maps can still create risks in orchard operations.
Software turns aerial data into a field task. Photogrammetry and agricultural analysis platforms reconstruct survey images, calculate vegetation indices, measure affected areas and preserve their coordinates.
Programs such as DJI Terra and DJI SmartFarm can create vegetation and prescription maps for compatible equipment. A typical workflow includes a survey, image processing, agronomic verification, task creation, application and a later control flight.
Keeping these stages in one digital workflow also improves documentation. Managers can review where treatments were applied, what rate was used and how the field changed afterward. Repeated records are useful for comparing seasons, evaluating interventions and planning future work.
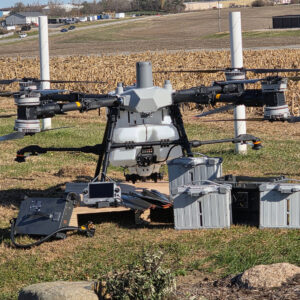
Once a farm has identified a regular need for aerial spraying or spreading, payload and daily operating volume become important considerations. The DJI Agras T50 and DJI Agras T100 illustrate two different capacity levels.
Specification | DJI Agras T50 | DJI Agras T100 |
Spray tank | 40 L | 100 L |
Maximum standard spray flow | 16 L/min | 30 L/min |
Flow with four sprinklers | 24 L/min | 40 L/min |
Effective spray width | 4–11 m | 5–13 m |
Maximum spreading payload | 50 kg | 100 kg |
Positioning accuracy with RTK | ±10 cm | ±10 cm |
Main sensing system | Phased-array radar and binocular vision | LiDAR, millimeter-wave radar and five-camera vision |
The T50 provides a balance between payload and transportability for mixed operations, orchards and medium-scale farms. The T100 is designed for higher-volume work where its larger tanks can reduce the number of refill cycles.
On a working farm, the payoff is straightforward: crews spend less time searching for faults, weed-free areas can be left unsprayed, and treatments can continue where tractors cannot enter. Thermal surveys have exposed blocked emitters before visible wilting, while drone-generated weed maps have cut herbicide use by about half in field trials.
The results should be measured in hours saved, hectares treated, product used and machinery passes avoided. These figures provide a better basis for choosing between a survey platform, the Agras T50 or the higher-capacity T100 than specifications alone.
Agricultural drones are used to survey crops, map weeds, identify irrigation problems, spray crop protection products and distribute seed or granular fertilizer.
RGB cameras record visible problems such as missing plants, lodging and standing water. Multispectral cameras capture green, red, red-edge and near-infrared light, which can be processed into NDVI and NDRE maps. These maps highlight areas that require closer inspection but do not provide a diagnosis on their own.
Thermal cameras can locate parts of the crop canopy that are warmer than surrounding plants. These areas may indicate insufficient water, blocked emitters, damaged irrigation lines or uneven soil moisture.
Drone imagery can be converted into a prescription map so that only weed-infested areas are treated. Field trials described in this article achieved herbicide or spray-mixture reductions of around 50 percent.
Processing software combines individual images into field maps, calculates vegetation indices and creates prescription files. Platforms such as DJI Terra and DJI SmartFarm can connect survey data with spraying or spreading missions.
The Agras T50 has a 40-litre spray tank and a maximum spreading payload of 50 kg. The T100 increases these capacities to 100 litres and 100 kg. The T50 suits mixed operations where transportability matters, while the T100 is intended for higher-volume work with fewer refill cycles.