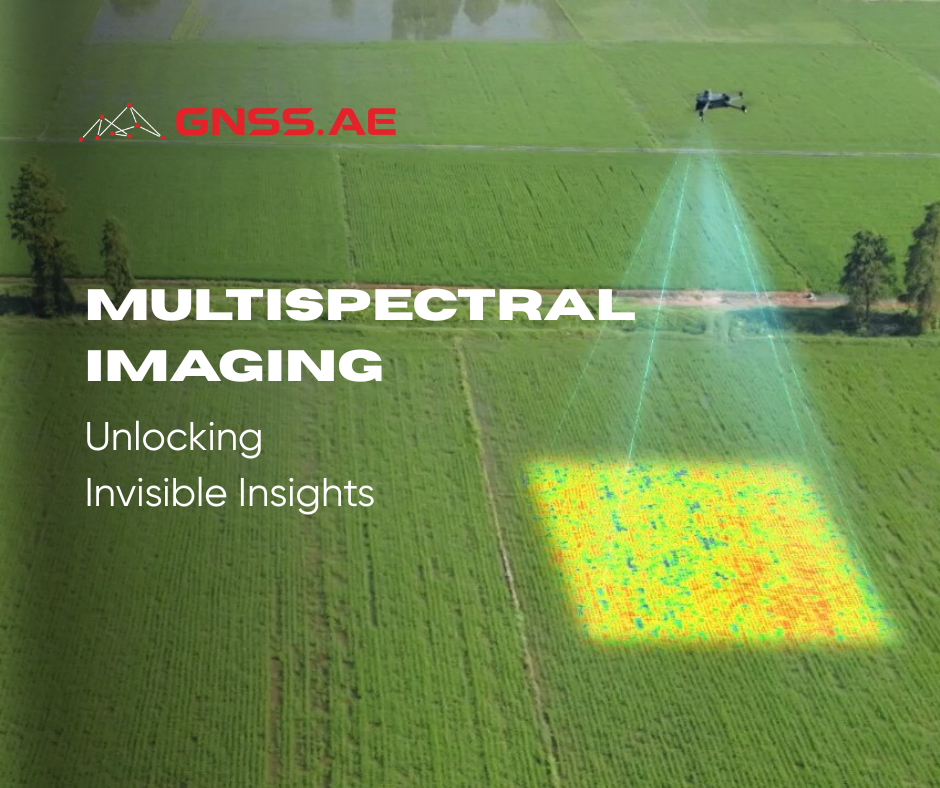
Multispectral imaging (MSI) is a technique for extracting information about objects by analyzing how they interact with electromagnetic radiation across different wavelength ranges. Over the recent years, MSI has emerged as a transformative technology, expanding the frontiers of what computer vision and remote sensing can achieve.
By capturing data across a spectrum that extends far beyond human vision—including ultraviolet (UV), visible light, near-infrared (NIR), and short-wave infrared (SWIR)—multispectral imaging offers unparalleled insights into materials, biological systems and the environment.
From precision agriculture and mineral exploration to medical diagnostics and quality control, MSI enables informed decision-making by detecting unique spectral signatures—specific patterns of light absorption, reflection, or emission—associated with different materials. In this article, we explore how multispectral imaging works, its key technologies and its most effective applications across industries.
Human vision is limited to the visible spectrum (approximately 400–700 nm), but the electromagnetic spectrum spans from high-energy gamma rays to long-wavelength radio waves. MSI systems exploit this range by isolating discrete spectral bands beyond the visible light spectrum to capture more detailed, application-specific information.
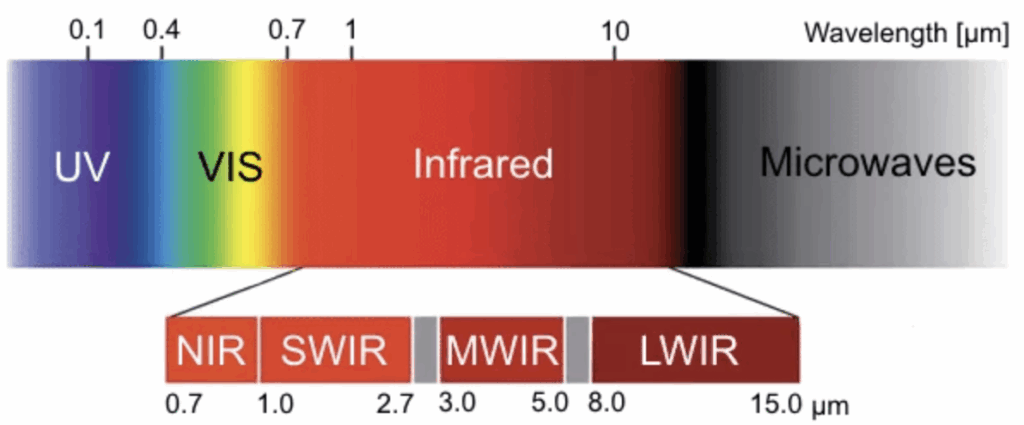
Multispectral systems typically focus on the following segments:
To explore the thermal imaging applications of MWIR and its comparison to LWIR and SWIR, read our recent article.
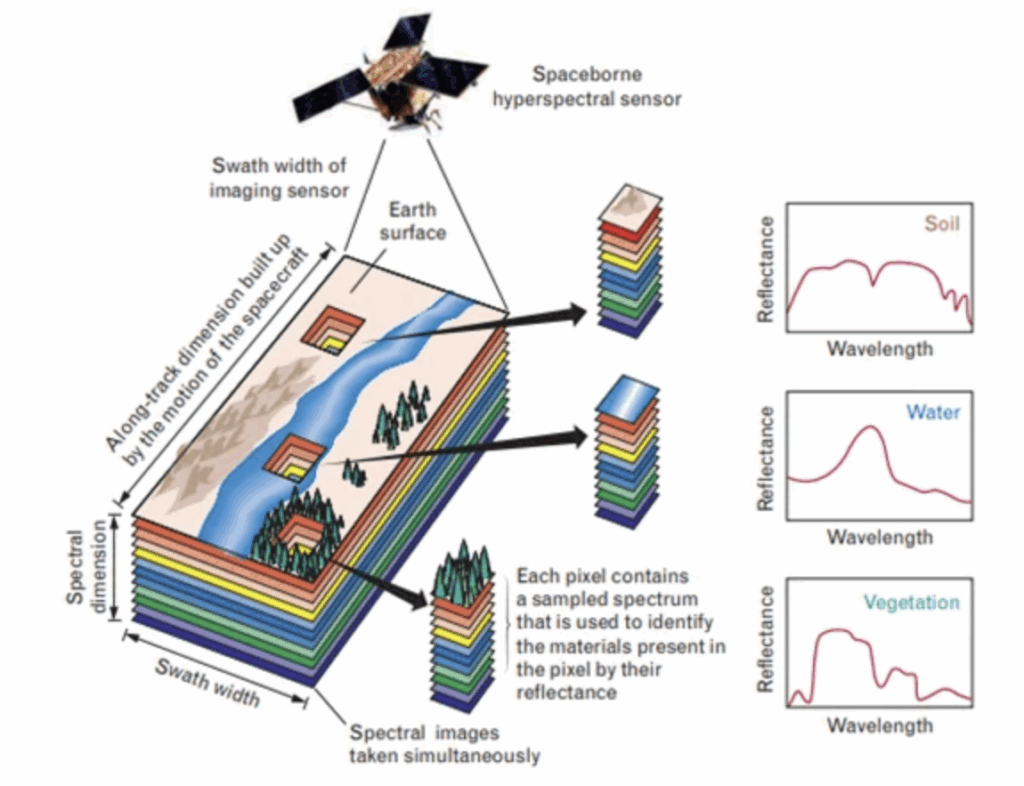
MSI is based on detecting how light interacts with matter. Different substances absorb and reflect light in characteristic ways across various wavelengths. These spectral interactions are recorded in individual image layers—each corresponding to a specific wavelength range—forming a multispectral data cube. The data-rich imaging process provides the foundation for advanced analysis in agriculture, precision farming and environmental monitoring.
| Spectral Band | Wavelength Range (µm) | Common Applications |
|---|---|---|
| Blue-Violet (Visible) | 0.42 – 0.55 | Used for oceanographic analysis, atmospheric correction, and calculating vegetation indices (e.g., NDVI). |
| Blue (Visible) | 0.45 – 0.52 | Ideal for shallow water bathymetry, sediment concentration, distinguishing soil from vegetation, differentiating deciduous vs. coniferous flora, and forest type mapping. |
| Green (Visible) | 0.52 – 0.60 | Aligns with the peak reflectance of healthy vegetation; used for biomass estimation, forestry classification, and mapping suspended sediments in turbid waters. |
| Red (Visible) | 0.63 – 0.69 | Captures chlorophyll absorption; valuable for identifying plant species, delineating soil boundaries, and geological feature detection (e.g., ore bodies, oil fields). |
| Near-Infrared (NIR) | 0.76 – 0.90 | Highly sensitive to vegetation biomass and moisture content; used for crop yield forecasting, soil identification, and delineating shorelines. |
| Short-Wave Infrared (SWIR) | 1.55 – 2.50 | Sensitive to water content in soil and plants; effective for drought monitoring, plant stress detection, and distinguishing snow from clouds and ice. |
| Thermal Infrared (Long-Wave IR) | 10.40 – 12.50 | Used for measuring land surface temperatures, detecting thermal anomalies, and geothermal activity mapping. |
| Thermal-Sensitive SWIR Sub-band | 2.08 – 2.35 | High reflectance from silica-rich materials, airborne dust, and bare soils; useful for mapping soil moisture, surface composition, and vegetation hydration levels. |
This expanded spectral coverage enables remote sensing professionals to extract highly specific insights from Earth’s surface and atmosphere, supporting applications from crop diagnostics to mineral exploration and oil spill detection.
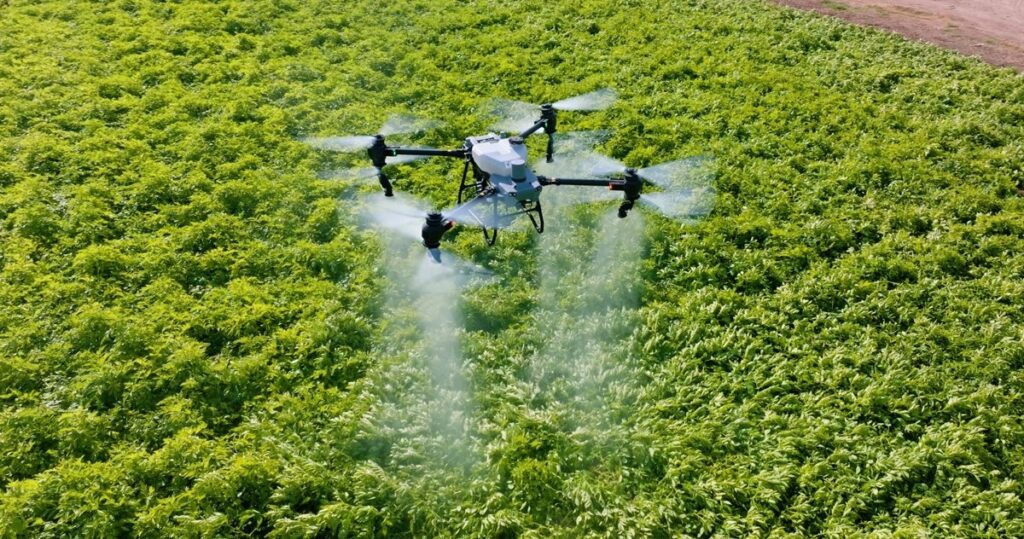
In addition to visual band analysis, drones can carry multispectral payloads that capture data in NIR, Red Edge, and SWIR bands, providing a deeper look into plant physiology, water stress, and nutrient distribution. When combined with AI-powered analytics and GIS systems, multispectral drone imaging becomes a powerful decision-support tool across industries.
Multispectral satellite sensors such as Landsat and Sentinel-2 provide large-scale coverage ideal for monitoring Earth’s surface over time. These platforms are widely used for:
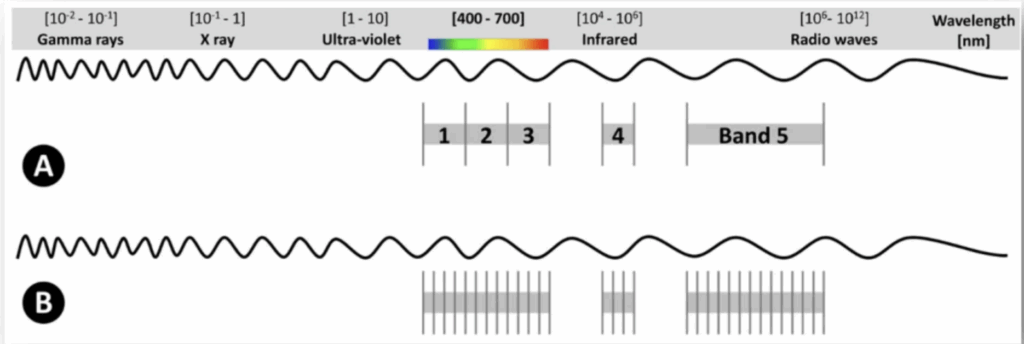
As shown in the figure above, (A) the Landsat system includes 11 spectral bands, while Sentinel-2 expands this to 13 bands, allowing for more detailed spectral observation. In contrast, advanced hyperspectral instruments can capture data in over 100 spectral channels, significantly enhancing the ability to discriminate between different materials (B).
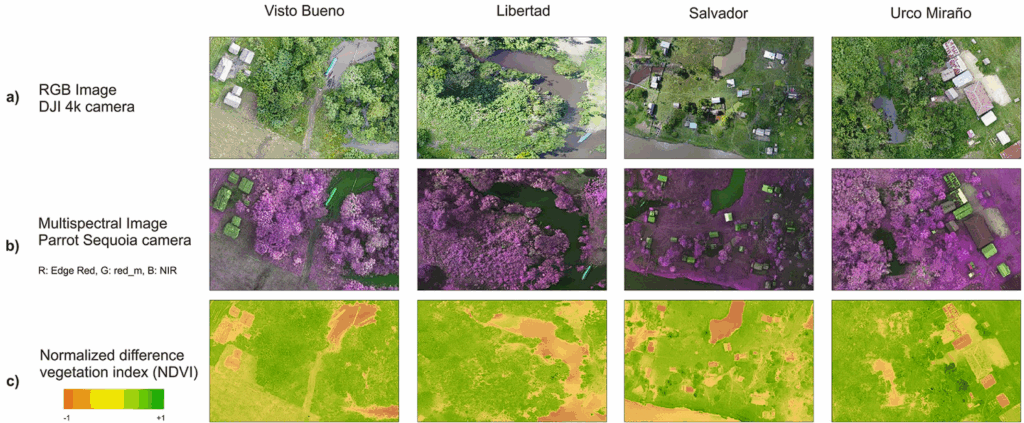
Multispectral imaging provides powerful data for agriculture, especially through vegetation indices such as NDVI (Normalized Difference Vegetation Index), NDRE (Normalized Difference Red Edge), and GNDVI (Green NDVI). These indices allow for in-depth, data-driven assessments of crop conditions across large areas.
By analyzing vegetation index maps derived from multispectral data, farmers can identify early signs of crop stress related to pests, diseases, water shortages, or nutrient deficiencies. For example, NDVI highlights plant vigor, with values closer to 1 indicating dense, healthy vegetation, and values near 0 suggesting sparse or unhealthy plant cover. NDRE provides more sensitivity to chlorophyll levels in mature crops, making it effective for mid-to-late growth stage analysis. GNDVI further enhances chlorophyll detection by emphasizing reflectance in the green spectrum.
In contrast to standard RGB imagery, which offers only a surface-level overview, vegetation indices deliver actionable insights that support crop yield forecasting, precision fertilization and efficient resource management.
While individual spectral bands provide foundational insights, vegetation indices derived from them—such as NDVI, NDRE, OSAVI, and GNDVI—translate this spectral data into meaningful agronomic indicators. The table below summarizes their specific uses and formulas
| Index | What It Measures | Primary Uses | Formula (Spectral Bands) |
|---|---|---|---|
| NDVI (Normalized Difference Vegetation Index) | Most widely used index for estimating plant greenness, density, and vigor. Strong indicator of chlorophyll content and crop health in early growth stages. |
| (NIR − Red) / (NIR + Red) |
| NDRE (Normalized Difference Red Edge Index) | Provides better chlorophyll sensitivity in mature plants by using the red edge band, which penetrates deeper into dense canopies than red light. |
| (NIR − Red) / (NIR + Red) |
| OSAVI (Optimized Soil-Adjusted Vegetation Index) | Designed for early growth stages when sparse vegetation allows soil reflectance to influence spectral readings. Incorporates a correction factor to minimize soil background effects. |
| (NIR − Red) / (NIR + Red + 0.16) |
| GNDVI (Green Normalized Difference Vegetation Index) | Uses green light instead of red to estimate chlorophyll content. Shown to be more stable than NDVI in high-density crops or later growth stages. |
| (NIR − Green) / (NIR + Green) |
While multispectral imaging is not a new concept, the integration of multispectral cameras with UAV platforms has revolutionized how this data is collected:
This approach enables a scalable and reliable workflow for precision agriculture, land management, and environmental monitoring.
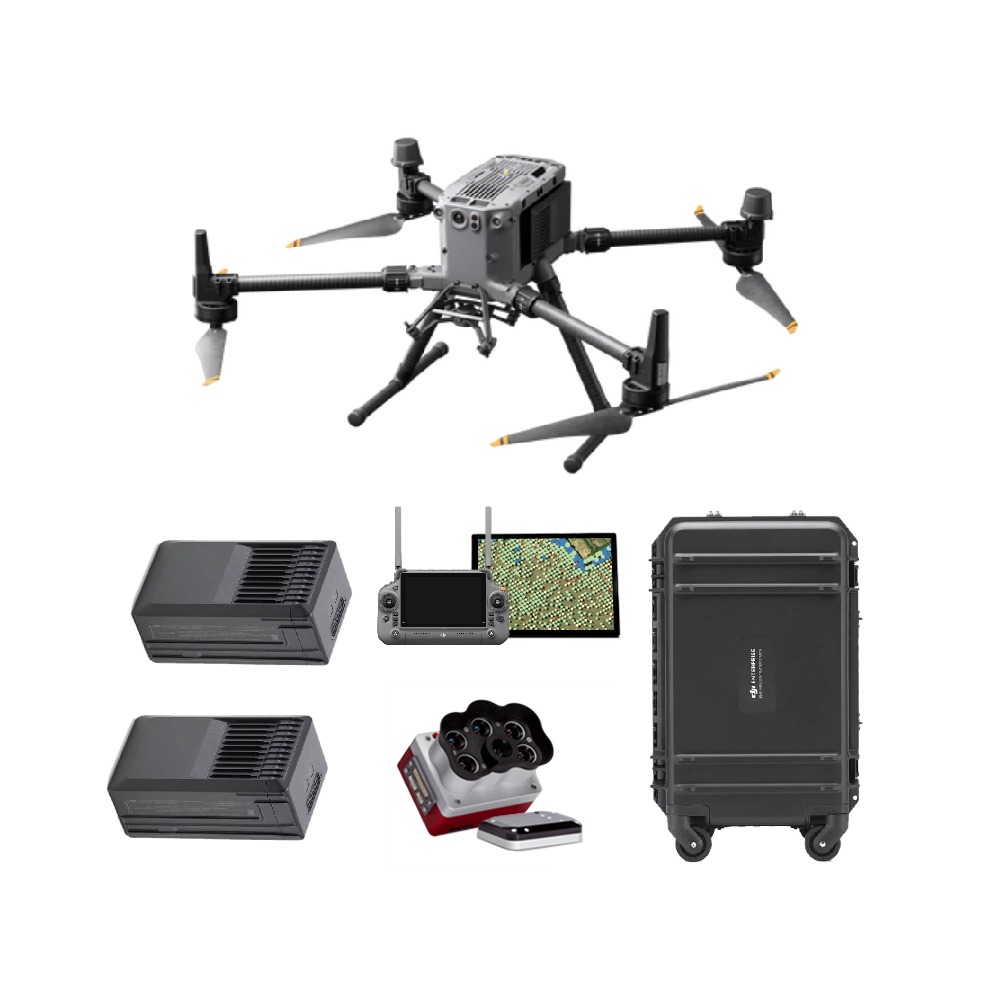
One widely adopted solution is the Micasense Rededge-P Multispectral Kit with DJI Skyport and DJI Matrice 350 RTK drone. This setup supports high-resolution multispectral imaging for tasks such as:
The RedEdge-P features five narrow spectral bands and a high-resolution panchromatic imager, delivering pan-sharpened outputs at 2 cm resolution from 60 meters altitude. This allows agronomists to identify subtle changes in vegetation, enabling earlier interventions and optimized input management.
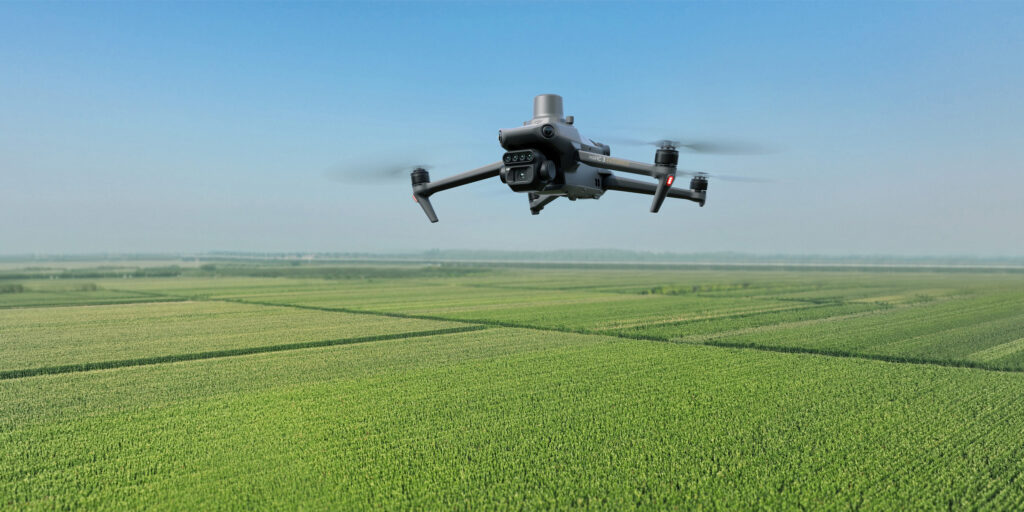
Another prime example is the DJI Mavic 3M, a compact multispectral drone tailored for agricultural surveying. It combines an RGB camera with a multispectral camera to scan and analyze crop growth with total clarity. Agricultural production management requires precision and data, and DJI Mavic 3M delivers both.
It enables terrain-follow aerial mapping of orchards—even on sloped terrain—and works with platforms like DJI Terra. The integrations allow users to reconstruct high-resolution orchard maps, automatically count trees, distinguish trees from other objects, and generate 3D flight routes for agricultural drones. This greatly enhances both safety and efficiency in automated crop spraying and monitoring tasks.
Multispectral imaging offers significant advantages over conventional imaging in the visible spectrum. By capturing data across additional spectral ranges—including infrared and thermal bands that are invisible to the human eye—it enables deeper insights and more comprehensive analysis of the Earth’s surface and atmosphere.
This expanded spectral sensitivity unlocks diverse applications across multiple fields, including agriculture, land management, and forestry. Multispectral imaging offers in-depth insights into plant health, soil composition, and ecosystem dynamics—enabling more informed decisions that drive higher yields, improved productivity, and greater operational efficiency.
When deployed on drones, multispectral systems deliver this data with speed, precision, and repeatability. Platforms like Micasense Rededge-P Multispectral Kit with DJI Skyport and DJI Matrice 350 RTK drone and DJI Mavic 3M exemplify how advanced tools can make high-resolution, terrain-aware imaging accessible and actionable for agriculture and land management professionals.
In summary, multispectral imaging delivers rich, actionable insights about vegetation, soil, and the broader environment. With drone integration, this data becomes faster, safer, and more cost-effective to collect—making MSI an indispensable tool in precision agriculture, resource management, and environmental monitoring.