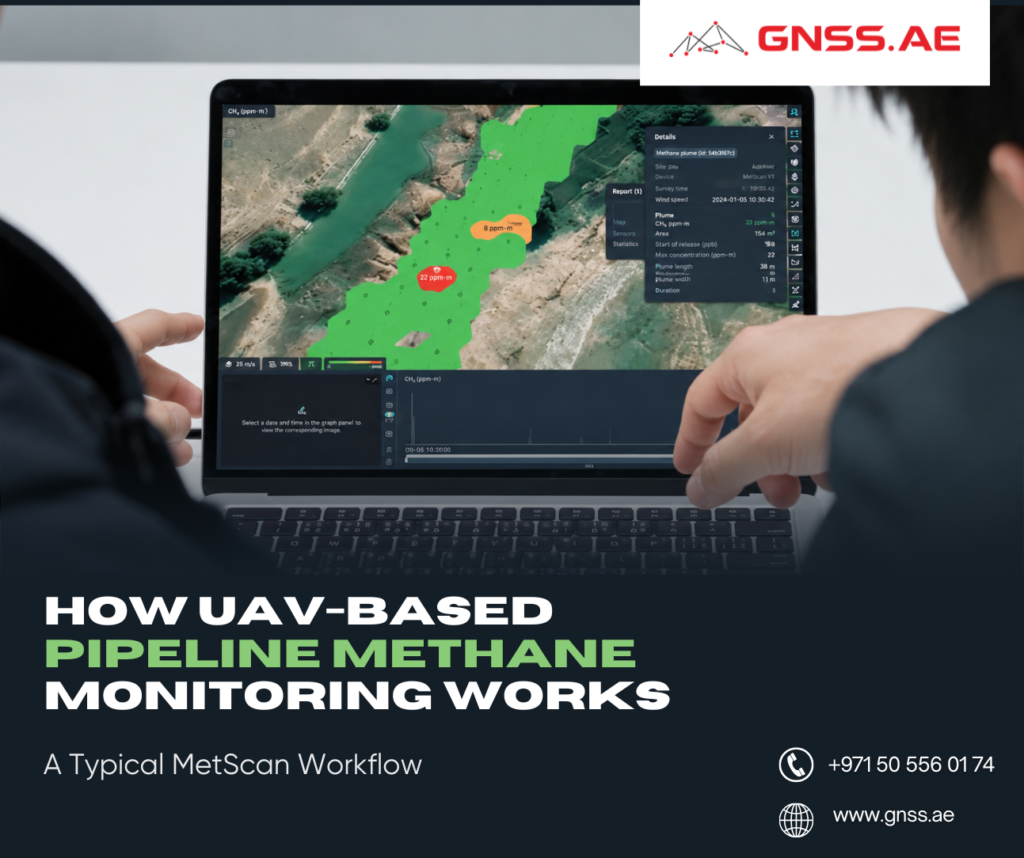
Methane leak inspections along pipelines need to cover long distances while still providing reliable, location-specific results. Traditional ground surveys can be slow and labor-intensive, especially in remote or difficult-to-access areas, while aerial surveys are only effective when supported by a structured inspection workflow.
This article walks through a typical UAV-based methane monitoring mission using MetScan and AIRINS.ai, from flight planning and Belt Scan data collection to AI-assisted analysis, reporting, and on-site verification. Along the way, we’ll look at the technologies that support reliable measurements and the deliverables operators receive after each inspection.
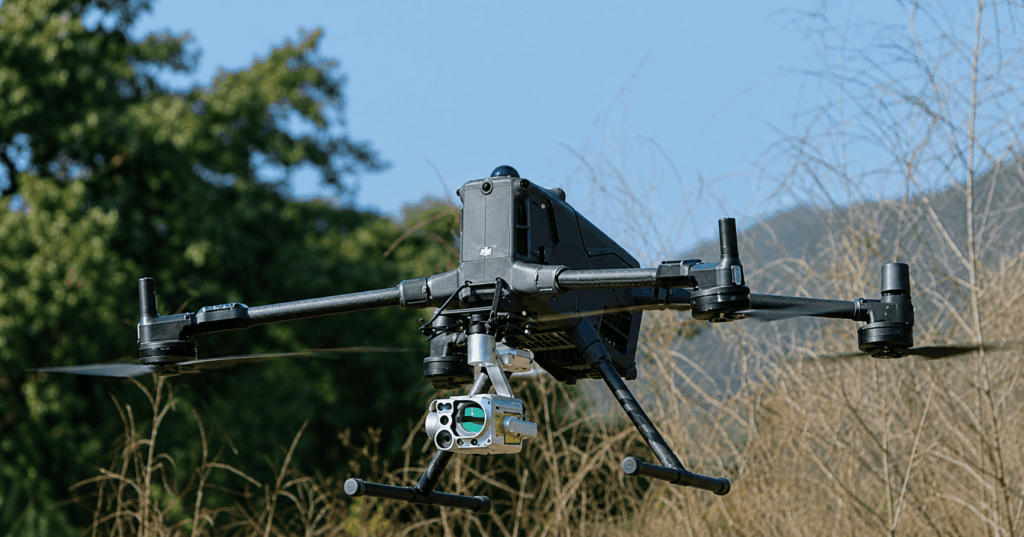
The first step is to identify the pipeline section that requires inspection. This may be part of a routine LDAR program, a post-maintenance survey, an inspection following nearby excavation work, or a rapid response to a suspected leak. Based on these requirements, operators create the flight plan in DJI Pilot and select the appropriate scanning mode.
For pipeline inspections, MetScan uses Belt Scan, a corridor-based workflow that continuously measures methane concentrations along and around the pipeline route. Before takeoff, operators also review weather conditions, particularly wind, as it influences methane dispersion and helps determine the most suitable flight parameters.
Flight altitude and speed are then adjusted to balance coverage and measurement density. In field demonstrations, MetScan successfully detected controlled methane leaks using multiple flight profiles, including 30 m AGL at 1 m/s, 30 m AGL at 3 m/s, and 70 m AGL at 1 m/s, demonstrating that the workflow can be adapted to different operational requirements.
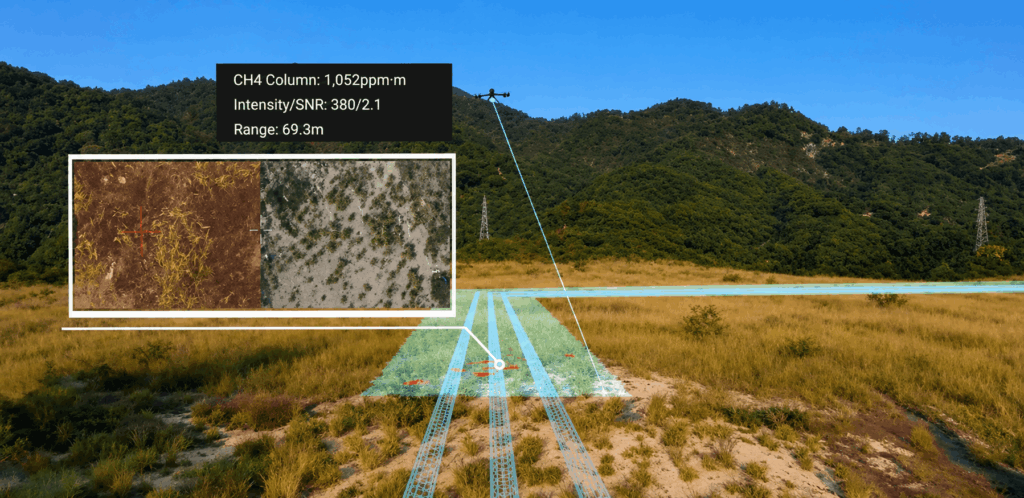
Once the mission begins, the UAV follows the pipeline while MetScan operates in Belt Scan mode. Instead of collecting measurements only along the flight path, the system continuously scans both sides of the corridor, creating a geo-referenced belt of methane measurements.
This approach increases the likelihood of detecting methane plumes that may have drifted away from the pipeline due to changing wind conditions. The workflow supports both automated waypoint missions and manual flights, making it suitable for routine inspections as well as more complex field conditions.
Throughout the flight, methane measurements are synchronized with video footage, allowing operators to review elevated methane readings together with their exact location and visual context during post-flight analysis.
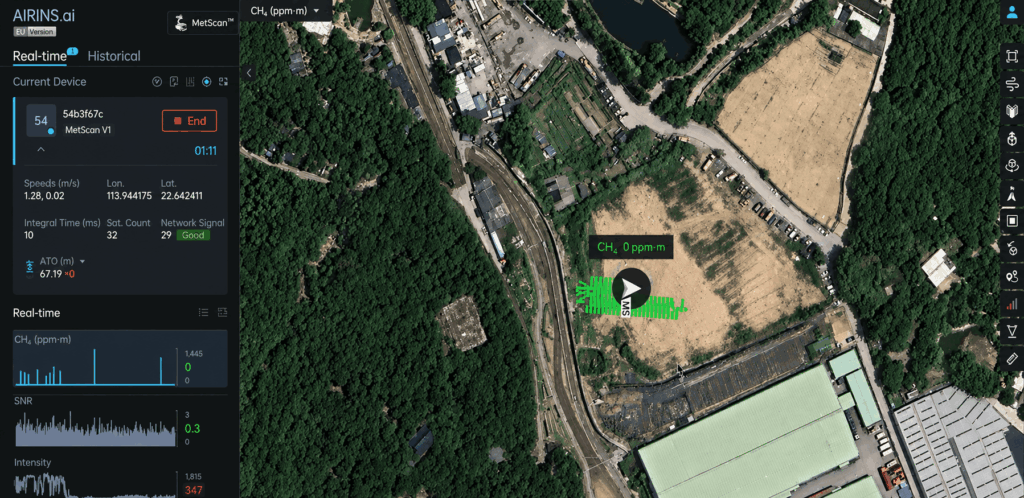
During the inspection, operators can monitor screening data in real time through AIRINS.ai to confirm that the pipeline has been fully covered and the mission is progressing as planned. This immediate overview helps identify potential coverage gaps while the UAV is still in the air, allowing adjustments without scheduling another site visit.
MetScan streams measurement data at up to 50 Hz, providing dense methane sampling throughout the flight. At the same time, its dual-view imaging system records synchronized wide-angle and telephoto video, ensuring that every methane measurement is linked to the corresponding visual scene for later analysis.
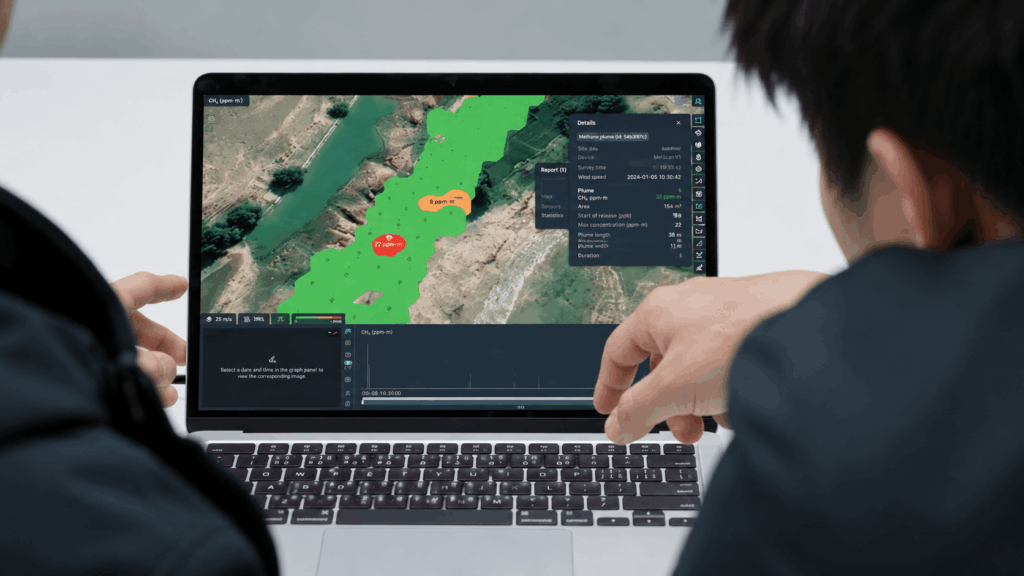
After the flight, the complete dataset—including methane measurements and synchronized video—is uploaded to AIRINS.ai for processing. Data can be transferred via Wi-Fi, while Starlink and mobile hotspots allow direct synchronization from the field. If network access is unavailable, missions can be copied to a computer via USB-C and uploaded later without data loss.
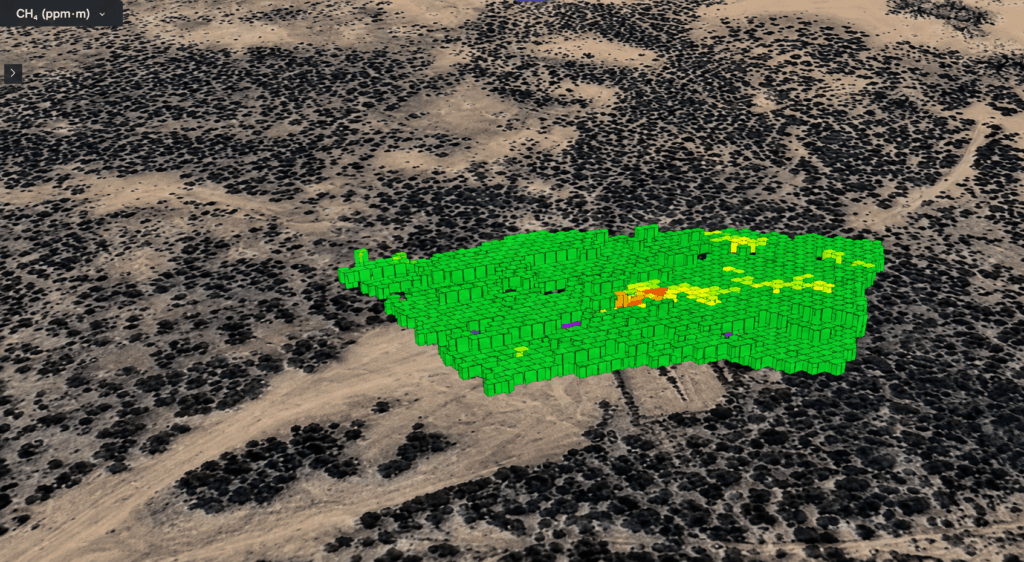
Once synchronized, each mission is available as an interactive 2D or 3D visualization with geo-referenced methane measurements overlaid on the inspected corridor. Operators can review the flight timeline, examine elevated methane readings, and compare results with previous inspections to identify recurring patterns or monitor changes over time.
Once processing is complete, AIRINS.ai automatically analyzes the inspection results and identifies areas with elevated methane concentrations. Suspected hotspots are ranked to help operators prioritize follow-up inspections instead of reviewing the entire dataset manually.
For each hotspot, the platform provides supporting information, including methane concentration values, precise coordinates, synchronized imagery, and an SNR-based confidence score. Operators can also generate shareable Google Maps links to guide field crews directly to the identified locations.
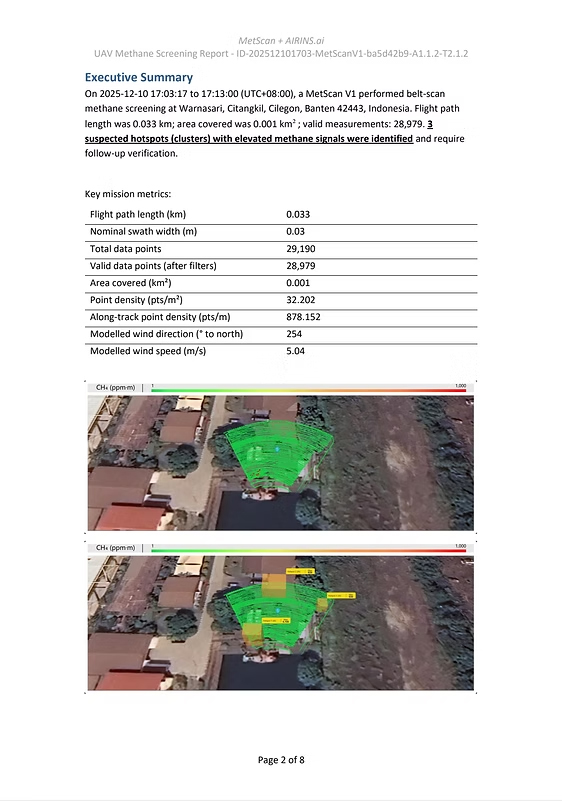
AIRINS.ai generates standardized inspection reports with a single click. Reports include mission details, screening methodology, QA/QC information, hotspot summaries, and supporting imagery, and can be exported in PDF or editable DOCX formats. For integration with GIS and asset management systems, inspection data is also available in CSV, JSON, and SHP formats.
Drone-based methane screening is designed to identify potential leak locations quickly, but suspected hotspots should always be verified before maintenance decisions are made.
Using the coordinates and supporting imagery provided by AIRINS.ai, field teams can navigate directly to the identified locations and confirm the presence of methane with handheld gas detectors or optical gas imaging (OGI) cameras. Once a leak is verified, operators can assess its severity, perform the necessary repairs, and, if required, conduct a follow-up UAV inspection to confirm that methane emissions have been eliminated.
Mission Planning → Belt Scan Inspection → Real-Time Monitoring → Cloud Processing → AI Analysis & Reporting → Ground Verification
In short:
A structured workflow is only as effective as the technology behind it. MetScan combines remote methane sensing, precise positioning, and onboard data processing to deliver consistent inspection results in real-world conditions.
Together, these technologies provide the consistent, high-quality data needed for reliable visualization, hotspot detection, and follow-up analysis in AIRINS.ai.
Each completed mission produces a set of outputs that can be used for analysis, reporting, and follow-up inspections.
Interactive visualizations allow operators to review methane measurements in 2D or 3D, examine the flight timeline, and compare results with previous inspections.
AI-assisted inspection reports summarize the mission, list suspected hotspots with their coordinates and methane concentration levels, and include supporting imagery. Reports can be exported in PDF or editable DOCX format for internal documentation or sharing with stakeholders.
For integration with existing GIS and asset management platforms, AIRINS.ai also supports exports in CSV, JSON, and SHP formats. In addition, shareable Google Maps links help field teams navigate directly to locations identified during the inspection.
By combining visualization, standardized reporting, and GIS-ready data, the workflow makes it easier to document inspections, prioritize follow-up work, and maintain a searchable history of pipeline monitoring activities.
Effective pipeline methane monitoring depends on more than just detecting gas—it requires a repeatable workflow that delivers reliable data from planning through verification.
By combining UAV-based Belt Scan inspections, real-time monitoring, cloud-based analysis in AIRINS.ai, and targeted ground verification, operators can inspect long pipeline corridors more efficiently while focusing field resources on the locations most likely to require attention.
As methane monitoring requirements continue to evolve, structured inspection workflows like this help improve consistency, simplify documentation, and support faster, more informed maintenance decisions.