Power transmission corridors are among the most challenging environments for aerial mapping. Survey teams must accurately capture thin conductors, terrain beneath vegetation, and clearance distances across long spans that often traverse complex terrain.
Traditional survey methods struggle to balance accuracy and efficiency at this scale. Ground surveys are precise but time-consuming, while photogrammetry can have difficulty reconstructing conductors, extracting terrain beneath canopy, and supporting reliable clearance analysis.
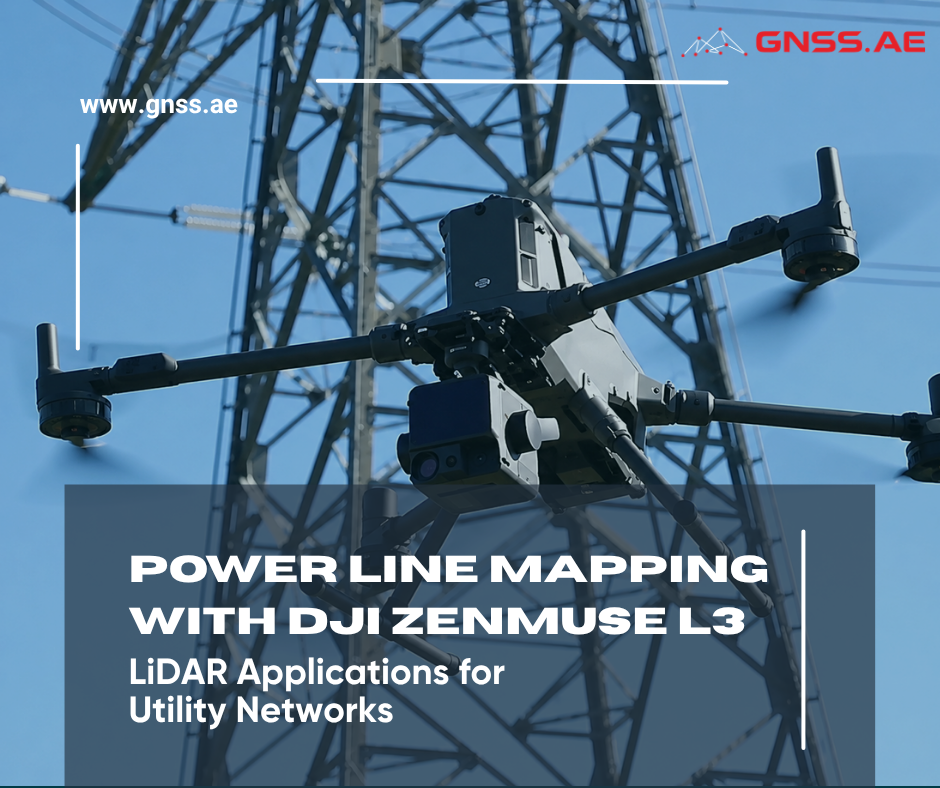
LiDAR addresses many of these challenges by directly measuring distance rather than reconstructing geometry from imagery. This allows conductors, structures, vegetation, and ground surfaces to be captured within a single dataset. The DJI Zenmuse L3 builds on this capability with features relevant to corridor mapping, including long-range performance, a smaller laser footprint, multiple scanning modes, and improved vegetation penetration.

Power line corridors combine several challenges that directly affect data quality and engineering analysis:
For utility operators, accuracy alone is not enough. Corridor datasets must deliver:
Any inconsistency in the data can affect clearance analysis, vegetation management, and maintenance planning.

Unlike photogrammetry, LiDAR measures distance directly rather than reconstructing geometry from imagery. This allows survey teams to capture conductors, vegetation, structures, and terrain as measurable 3D data, regardless of texture, lighting conditions, or visual contrast.
For utility corridors, this provides several advantages:
These capabilities make LiDAR particularly effective for transmission and distribution mapping.
One of the most significant challenges in transmission mapping is maintaining data quality while operating at safe distances from infrastructure.
Depending on pulse repetition settings, the Zenmuse L3 can detect low-reflectivity targets at distances of up to 950 m. This gives survey teams greater flexibility when mapping tall transmission structures, long spans, and corridors that cross difficult terrain.

In practice, operators can maintain safer flight profiles while still capturing the conductor and tower geometry needed for engineering analysis. The additional range also supports automated corridor inspections, allowing Power Line Follow missions to be conducted at higher altitudes with fewer manual adjustments during flight.

Range alone does not determine LiDAR performance in utility surveys. The size of the laser footprint is equally important, particularly when mapping conductors.
At 120 m AGL, the Zenmuse L3 produces a beam diameter of approximately 41 mm—significantly smaller than that of the Zenmuse L2 at the same altitude. A smaller footprint improves target separation, increasing the probability of isolating conductors from nearby vegetation and background surfaces.
This results in cleaner conductor extraction, improved wire continuity, and more reliable geometry for clearance and sag analysis.
The higher level of detail also benefits asset modeling, making components such as insulators, crossarms, attachment points, and fittings more clearly identifiable within the point cloud.
Vegetation remains one of the primary obstacles in utility corridor mapping. In heavily forested areas, a single laser return often provides only the top of the canopy, offering little information about what lies beneath.
Unlike Zenmuse L2, Zenmuse L3 supports up to 16 returns per pulse at lower point rates. Rather than recording a single reflection, the sensor can capture multiple interactions as the laser passes through different layers of vegetation. A single pulse may generate returns from the canopy, intermediate branches, understory vegetation, and eventually the ground surface.
More ground points beneath canopy improve conductor-to-ground clearance calculations, support vegetation encroachment analysis, and reduce uncertainty when modelling corridors during leaf-on conditions.

Utility corridors often combine open terrain, dense vegetation, transmission structures, and steep elevation changes within a single survey. To adapt to these conditions, the Zenmuse L3 offers three scanning modes.
Scanning Mode | Key Characteristics | Best Suited For |
Linear Mode | Repetitive scan pattern that maintains consistent point spacing across the survey area. | Terrain modeling, topographic surveys, and open corridors with limited vegetation. |
Star Mode | Varies the scanning angle during flight, capturing targets from multiple directions and improving structural detail. | Particularly useful for corridors containing towers, poles, and complex infrastructure geometry. |
Non-Repetitive Mode | Continuously changes the scan pattern to reduce shadowing effects and increase the likelihood of capturing returns through gaps in vegetation. | Dense forest corridors, mountainous terrain, and projects where maximizing ground visibility beneath canopy is a priority. |
Selecting the appropriate scanning mode can improve point cloud completeness, conductor extraction, and terrain classification, particularly in complex corridor environments.

One of the most expensive problems in corridor mapping is discovering data gaps after returning from the field. A missed section of conductor, insufficient ground penetration, or an issue with trajectory data can force a return visit, increasing project costs and delaying delivery.
To reduce this risk, the Zenmuse L3 supports real-time point cloud visualization in DJI Pilot 2. During a mission, operators can verify that conductors, structures, vegetation, and terrain are being captured correctly and identify coverage issues before leaving the site.
DJI Pilot 2 also monitors GNSS status, trajectory quality, and IMU performance throughout the mission. Potential issues can be identified before the aircraft leaves the site rather than during post-processing.
For long utility corridors, this significantly reduces the risk of incomplete datasets and unnecessary re-flights.

DJI Terra provides an integrated processing environment for Zenmuse L3 projects, combining trajectory processing, point cloud generation, classification, and model creation within a single workflow.
Typical processing steps include:
From there, the data can be used to generate digital elevation models, contour maps, colourized point clouds, and surface models. Final outputs can be exported in industry-standard formats for use in GIS, CAD, and utility asset management platforms.
The final point cloud is rarely the end product. Utility companies use LiDAR data to generate specific deliverables that support planning, maintenance, and compliance activities.
Common LiDAR deliverables include:
Because all of these outputs originate from the same survey, utilities gain a consistent dataset that can be shared across engineering, operations, GIS, and vegetation management teams.
A corridor mapping project in Quebec demonstrates the impact of the Zenmuse L3 in heavily vegetated environments.
The survey covered power lines running through dense forest, where summer foliage significantly reduced visibility of conductors and ground surfaces. Previous surveys using the Zenmuse L2 often struggled to extract reliable conductor, pole, and terrain data under full canopy conditions, limiting data collection to periods with reduced vegetation.


To evaluate the performance of the Zenmuse L3, the corridor was surveyed using a DJI Matrice 400 equipped with the new LiDAR payload. Flights were conducted at 100 metres above ground level with a speed of 8 m/s, 50 percent overlap, 350 kHz pulse rate, Star Mode scanning, and eight returns enabled.
After processing in DJI Terra, DJI Modify, and Trimble Business Center, the results showed improved ground visibility beneath canopy, more consistent conductor extraction, and clearer pole definition compared to previous surveys.
Most importantly, the project demonstrated that reliable data for clearance analysis, vegetation assessment, and terrain modeling could be collected during leaf-on conditions. This reduced dependence on seasonal survey windows and provided greater flexibility for maintenance planning and project scheduling.
Utility corridors remain one of the most demanding environments for aerial mapping. Conductors, dense vegetation, tall structures, and complex terrain all place high demands on data quality and survey methodology.
LiDAR is well suited to these challenges because it measures geometry directly, enabling more reliable conductor modeling, terrain extraction, and clearance analysis than image-based methods alone. With improvements in range, footprint size, multiple-return capability, scanning flexibility, and real-time quality verification, the Zenmuse L3 expands what can be achieved in utility corridor surveys.
For utilities and survey teams, the key benefit is consistency: accurate conductor, vegetation, and terrain data that can support engineering analysis, maintenance planning, and asset management across a wide range of operating conditions.