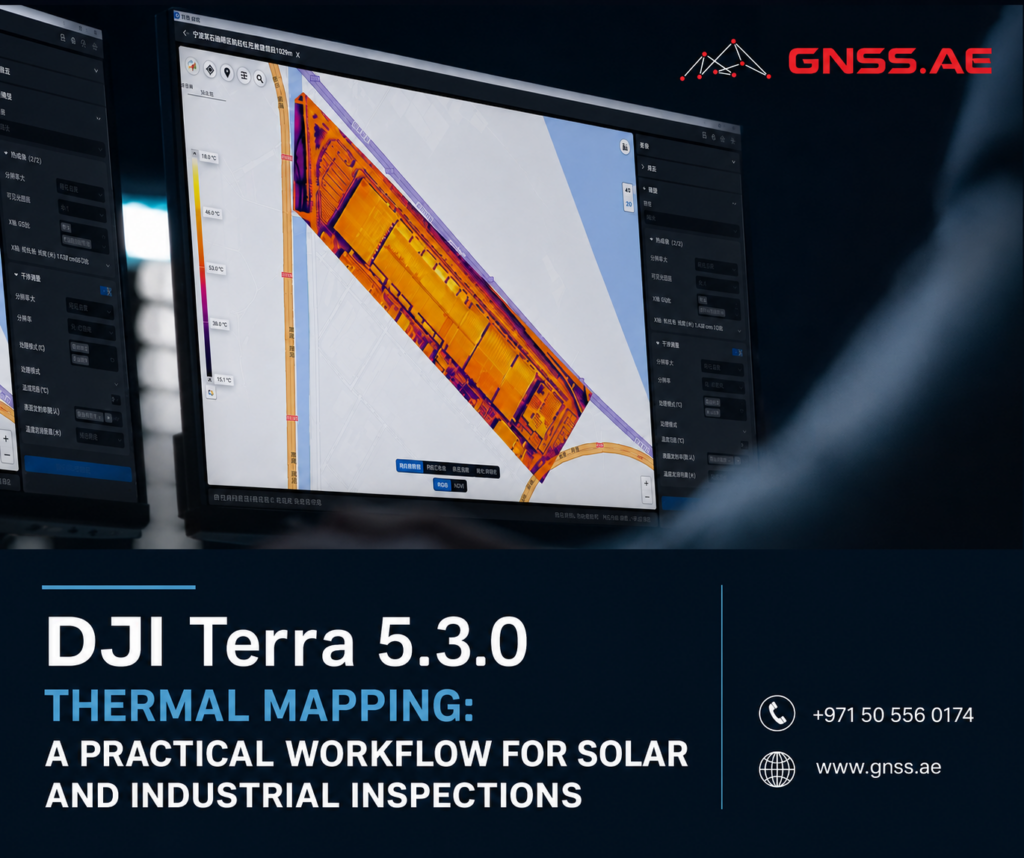
Until recently, a DJI thermal inspection often ended with a folder of radiometric images that had to be reviewed one by one. That may be fine for a small roof or a single electrical cabinet, but it becomes time-consuming on a solar farm, tank farm or large industrial site.
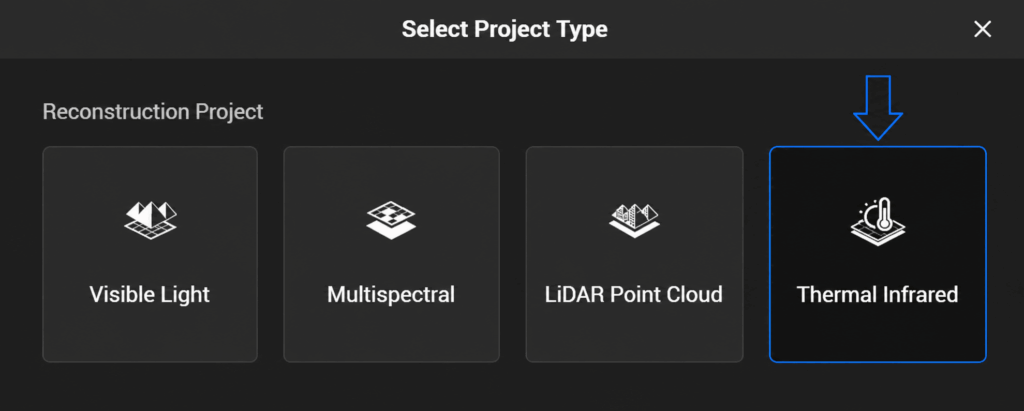
DJI Terra 5.3 adds Thermal Infrared 2D Reconstruction. The workflow combines thermal and visible-light images captured during the same flight, uses the RGB images for aerial triangulation and registers the thermal data to the resulting map. The result is a thermal orthomosaic that retains temperature information for measurement and reporting.
This article explains how to collect a suitable dataset, configure the temperature parameters and avoid the field mistakes most likely to compromise the result.
DJI Terra uses two synchronized image sets for different purposes:
Once reconstruction is complete, the operator can check temperatures at individual points, along lines or across selected areas. Terra provides ten colour palettes, adjustable temperature display ranges and exports for PDF reports and XLSX measurement data.
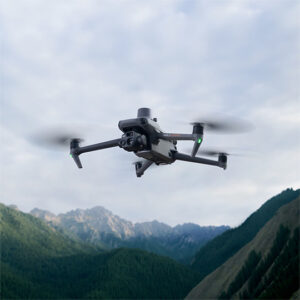
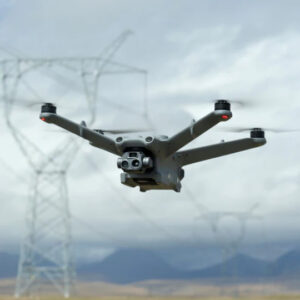
DJI lists the Mavic 3T, Matrice 3TD, Matrice 4T and Matrice 4TD among the supported aircraft, along with the Zenmuse H20N, H20T and H30T payloads. Both camera streams need to be recorded during the mission.
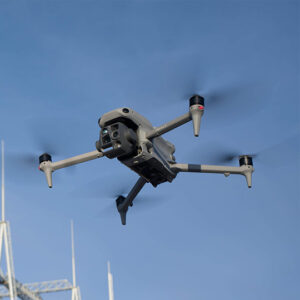
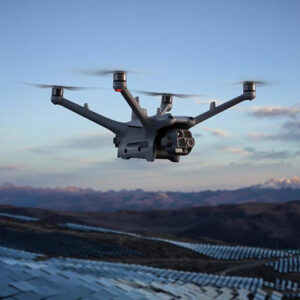
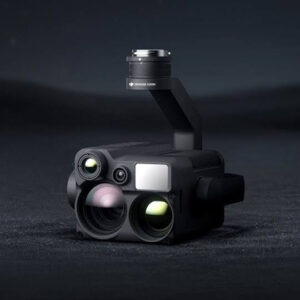
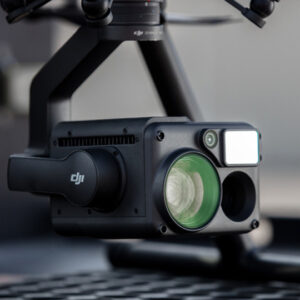
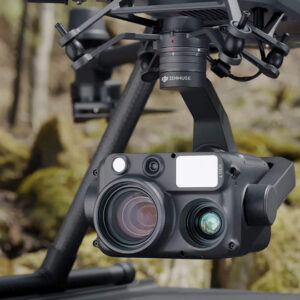
Thermal and RGB sensors have different resolutions. A flight planned only around the visible camera may produce a good-looking RGB orthomosaic while leaving the thermal layer too coarse for detailed inspection. DJI therefore recommends calculating the ground sampling distance from the thermal camera.
Setting | Recommended approach |
Mission type | Use an orthophoto mission in DJI Pilot 2 and enable both the visible-light and thermal cameras. |
GSD | Calculate it from the thermal sensor, not the RGB sensor. |
Standard overlap | At least 60% forward and 50% side overlap. |
Repetitive or weak-texture surfaces | Increase overlap to 80% forward and 70% side. This is particularly relevant to uniform roofs, water and repeating rows of solar modules. |
Flight altitude | Keep the aircraft below 120 m and comply with local operating limits. |
Target distance | For detailed inspection work, keep the aircraft within 60 m of the target. |
Lighting | Capture in sufficient daylight because the visible images are required for aerial triangulation. |
The overlap figures are minimum planning values, not a guarantee that every dataset will reconstruct. Solar arrays, metal roofs and water surfaces contain repeated patterns or limited visual texture, so Terra has fewer unique features to match between photographs. Higher overlap gives the software more common features and more viewing positions.
For close industrial assets, maintain a stable distance and avoid abrupt yaw or speed changes. If the mission combines several blocks or flight heights, preserve overlap between them rather than treating each block as a separate set of images.
Standard radiometric thermal images are required. Images captured in Super Resolution mode cannot be used for thermal reconstruction. The camera gain should also be selected for the expected surface-temperature range before the mission. High-gain and low-gain ranges differ between payloads, so the applicable camera specification should be checked rather than applying one range to every supported sensor.
A thermal camera measures infrared radiation and converts it into an apparent surface temperature. That conversion depends heavily on emissivity — the ability of a surface to emit thermal radiation compared with an ideal emitter.
DJI Terra provides built-in material presets and also accepts custom emissivity values. The default General Non-Metal setting uses an emissivity of 0.95 and is suitable for many materials, including concrete, brick, rubber, wood and vegetation. DJI also provides a photovoltaic-panel preset at 0.85.
These presets provide a practical starting point, but the value used for an inspection should match the actual surface and take into account its coating, viewing angle and the inspection conditions.
Low-emissivity and reflective materials require particular care. Unpainted metal, for example, can reflect the sky, sunlight or nearby hot equipment. This can produce an apparent hot or cold area that does not represent the actual temperature of the material. A sharp temperature contrast on the map should therefore be checked against the RGB image and asset geometry and, where necessary, verified with a contact measurement.
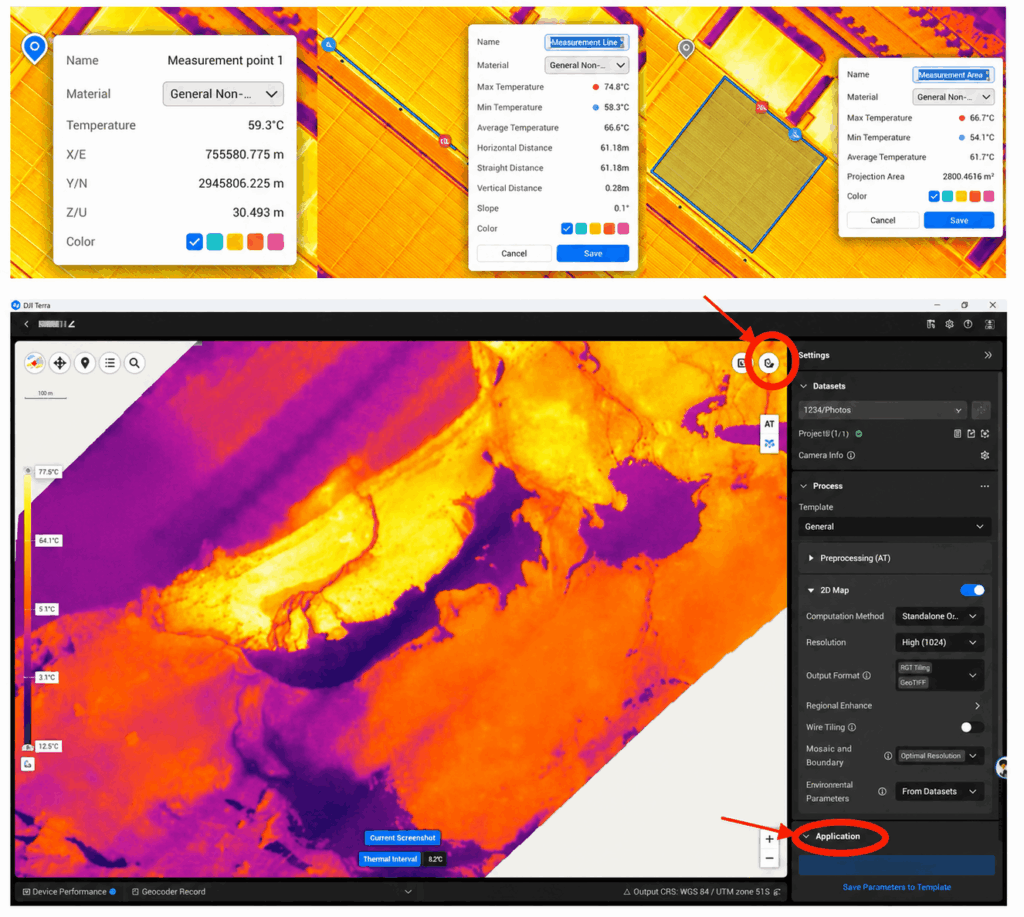
Terra also allows the operator to configure:
The aircraft stores some parameters in the image metadata, while defaults may be used for values that were not measured. For repeat inspections, it is worth recording the field conditions and entering measured values whenever they are available. Comparing two maps becomes much less meaningful if one survey uses measured humidity and reflected temperature while the other relies on unrelated default values.
Colour palettes do not change the underlying temperature data. They only change how that data is displayed. For time-series inspections, use the same palette and a fixed temperature range for each survey date. Otherwise, a change in the display settings can make an unchanged asset look different from one inspection to the next.
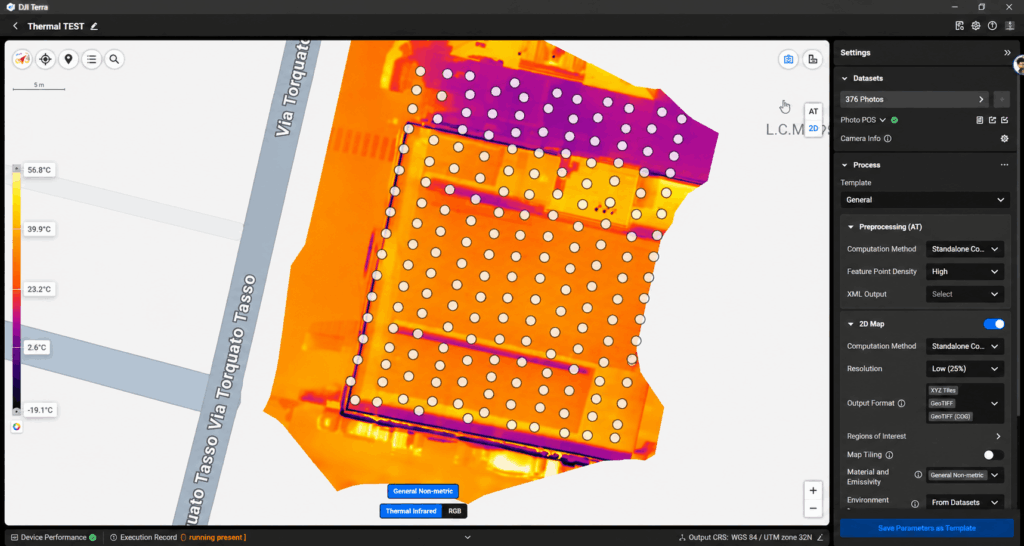
The office workflow follows six steps:
A point measurement is useful for checking a specific module, vent or pipe connection. A line can reveal a temperature gradient across a roof, riverbank or pipe rack. An area measurement is more suitable for defining the extent of an affected roof section or comparing groups of photovoltaic modules.
The final measurements can be exported as a PDF for a client-facing inspection record or as XLSX data for further analysis. The report should retain the flight date and time, aircraft and payload, gain mode, emissivity, environmental parameters and any temperature thresholds used by the inspection team. Without this context, an isolated temperature value is difficult to reproduce or defend later
A thermal orthomosaic gives the inspection team one continuous view of a photovoltaic site instead of hundreds or thousands of separate frames. Suspected hot cells, modules or strings can be marked on the map, measured and sent to a maintenance team with their location and surrounding context.
For reliable comparison, flights should be conducted under similar operating and weather conditions. Irradiance, wind, cloud cover, module load and viewing angle can all change the observed temperature pattern. The map helps prioritize field checks; electrical testing is still required to confirm the fault and its cause.
Area measurements can define the extent of an insulation defect, moisture-related anomaly or heat leak. Mission timing needs particular attention: the surface must have enough thermal contrast to reveal the defect, while the visible camera still needs sufficient light for aerial triangulation. This may leave a narrower capture window than a conventional RGB roof survey.
On factories, tank farms and pipe racks, a thermal map can document temperature distribution across equipment and identify areas that deserve closer inspection. During a fire response, repeated maps can help teams compare the position and extent of hot zones over time. The capture geometry, emissivity and temperature range should remain consistent if the maps will be compared.
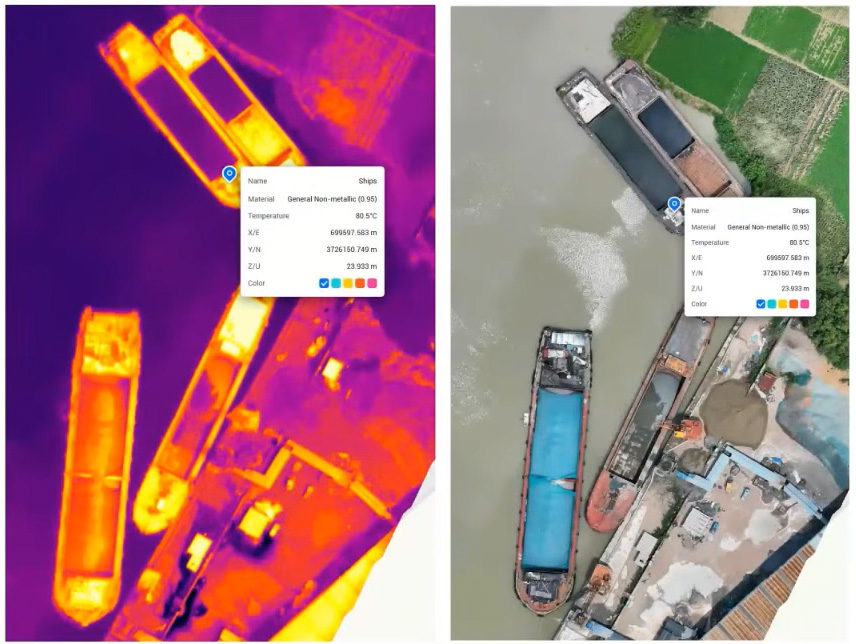
Line and area measurements can reveal a surface-temperature change where a warmer discharge meets a river, canal or coastal area. Thermography can help locate a point for on-site investigation, but it does not identify the discharged substance. Water sampling and other environmental measurements remain necessary for enforcement or root-cause analysis.
Before processing, check the dataset for the following problems:
These checks should be part of the field procedure. Reconstruction software cannot restore thermal detail that the sensor did not capture or correct temperature inputs that were never recorded.
In one municipal fire-safety workflow, an inspection team used a DJI Zenmuse H30T to survey factory premises from an altitude of around 100 m. Instead of reviewing individual thermal frames, the team created a 2D thermal map of the site in DJI Terra.
The map allowed operators to separate normal-temperature areas from potential high-temperature hazards and measure the extent of an anomaly directly on the image. This is useful for routine inspections of equipment, storage areas, pipe racks and other infrastructure where overheating may develop before it becomes visible during a standard visual check.
Repeated flights can add another layer of value. When the same area is mapped at defined intervals using comparable flight parameters and temperature settings, inspection teams can track whether a hot zone is expanding, shrinking or remaining stable. The resulting PDF or XLSX records can then support maintenance planning and inspection documentation
DJI Terra 5.3 brings thermal inspection into the same mapped workflow already familiar to photogrammetry teams. Its value is clearest on sites where individual-image review creates gaps: extensive solar arrays, large roofs, industrial facilities and long environmental inspection areas.
The quality of the result still begins in the field. Plan the mission from the thermal sensor, collect both image streams, use enough overlap and document the radiometric parameters. With those controls in place, the final deliverable can show where an anomaly is, how large it is and how its temperature varies across the asset.
Yes. DJI Terra 5.3 can combine visible-light and thermal images captured during the same flight to produce a 2D thermal orthomosaic containing temperature data.
Thermal 2D reconstruction supports the DJI Mavic 3T, Matrice 3TD, Matrice 4T and Matrice 4TD. Compatible payloads include the Zenmuse H20T, H20N and H30T.
Yes. DJI Terra uses visible-light images for aerial triangulation and spatial geometry. The thermal images are then aligned and reconstructed into the temperature map. Both image sets are required.
DJI recommends at least 60% forward overlap and 50% side overlap for standard sites. For water, repetitive roofs, solar panels and other low-texture surfaces, increase this to 80% forward and 70% side overlap.
Emissivity affects how measured infrared radiation is converted into surface temperature. Using the wrong value can produce inaccurate readings, particularly on reflective materials such as bare metal. DJI Terra provides material presets and supports custom emissivity values.
Yes. After reconstruction, users can measure temperatures at individual points, along lines and within selected areas. This makes it possible to locate anomalies and estimate their extent on the map.
Yes. Temperature measurements can be exported as PDF reports or XLSX data for inspection records, further analysis and comparison between surveys.